Unlock a world of possibilities! Login now and discover the exclusive benefits awaiting you.
- Qlik Community
- :
- Forums
- :
- Analytics & AI
- :
- Products & Topics
- :
- App Development
- :
- Pivot table question
- Subscribe to RSS Feed
- Mark Topic as New
- Mark Topic as Read
- Float this Topic for Current User
- Bookmark
- Subscribe
- Mute
- Printer Friendly Page
- Mark as New
- Bookmark
- Subscribe
- Mute
- Subscribe to RSS Feed
- Permalink
- Report Inappropriate Content
Pivot table question
Hi
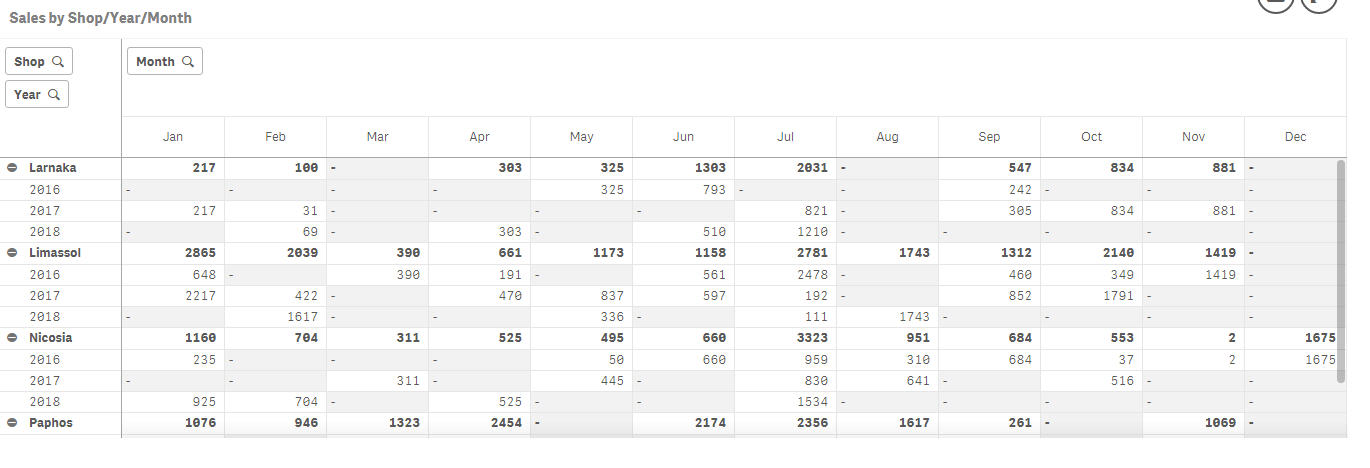
I have the following pivot table and have a couple of requirements which I am struggling with:
a) For the YEARS I only want the last 2 years worth of data to show (i.e. 2017 and 2018 with this data set)
b) For each shop we need to see an extra row (after 2018 in this sample) that will show the difference between the 2 preceding years as a percentage (e.g. July/Nicosia it will be 1534-830 = +84%)
c) After the December column I would like to see 2 column totals:
i) YTD totals (for both years - in other words Jan-Sep for both 2018 and 2017 - see my YTD and LYTD flags that I created in code
ii) Yearly "Total" for the whole row
d) Row totals:
- By Shop
- Grand Total
I would appreciate any assistance - attaching simplified application and data
Thanks
Alexis