Unlock a world of possibilities! Login now and discover the exclusive benefits awaiting you.
- Qlik Community
- :
- Forums
- :
- Analytics & AI
- :
- Products & Topics
- :
- App Development
- :
- Map Label
- Subscribe to RSS Feed
- Mark Topic as New
- Mark Topic as Read
- Float this Topic for Current User
- Bookmark
- Subscribe
- Mute
- Printer Friendly Page
- Mark as New
- Bookmark
- Subscribe
- Mute
- Subscribe to RSS Feed
- Permalink
- Report Inappropriate Content
Map Label
Hi Qlik Experts,
I'm trying to use GeoAnalytics to show the sales of different stores. I have a GeoPoint field that I used to plot the points on map. However these points don't show the name of the corresponding stores. It seems like the only way to work around is colouring the points by "store name", which is not ideal. I have hundreds of stores and would like to colour the points by their year over year growth.
Any ideas on suggestion is welcome!
Thanks,
Shirley
Accepted Solutions
- Mark as New
- Bookmark
- Subscribe
- Mute
- Subscribe to RSS Feed
- Permalink
- Report Inappropriate Content
Hi
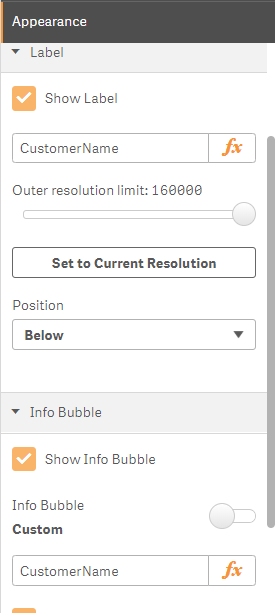
In GEO Bubble layer please set label and Bubble label by Store Name field in data model
example
Regards,
An Pham
- Mark as New
- Bookmark
- Subscribe
- Mute
- Subscribe to RSS Feed
- Permalink
- Report Inappropriate Content
Hi
In GEO Bubble layer please set label and Bubble label by Store Name field in data model
example
Regards,
An Pham
- Mark as New
- Bookmark
- Subscribe
- Mute
- Subscribe to RSS Feed
- Permalink
- Report Inappropriate Content
Thanks An, it solved the problem perfectly!