Unlock a world of possibilities! Login now and discover the exclusive benefits awaiting you.

- Qlik Community
- :
- Forums
- :
- Analytics & AI
- :
- Products & Topics
- :
- App Development
- :
- Map chart & KML on custom floorplan
- Subscribe to RSS Feed
- Mark Topic as New
- Mark Topic as Read
- Float this Topic for Current User
- Bookmark
- Subscribe
- Mute
- Printer Friendly Page

 schmidtj
- Mark as New
- Bookmark
- Subscribe
- Mute
- Subscribe to RSS Feed
- Permalink
- Report Inappropriate Content
Map chart & KML on custom floorplan
Hi,
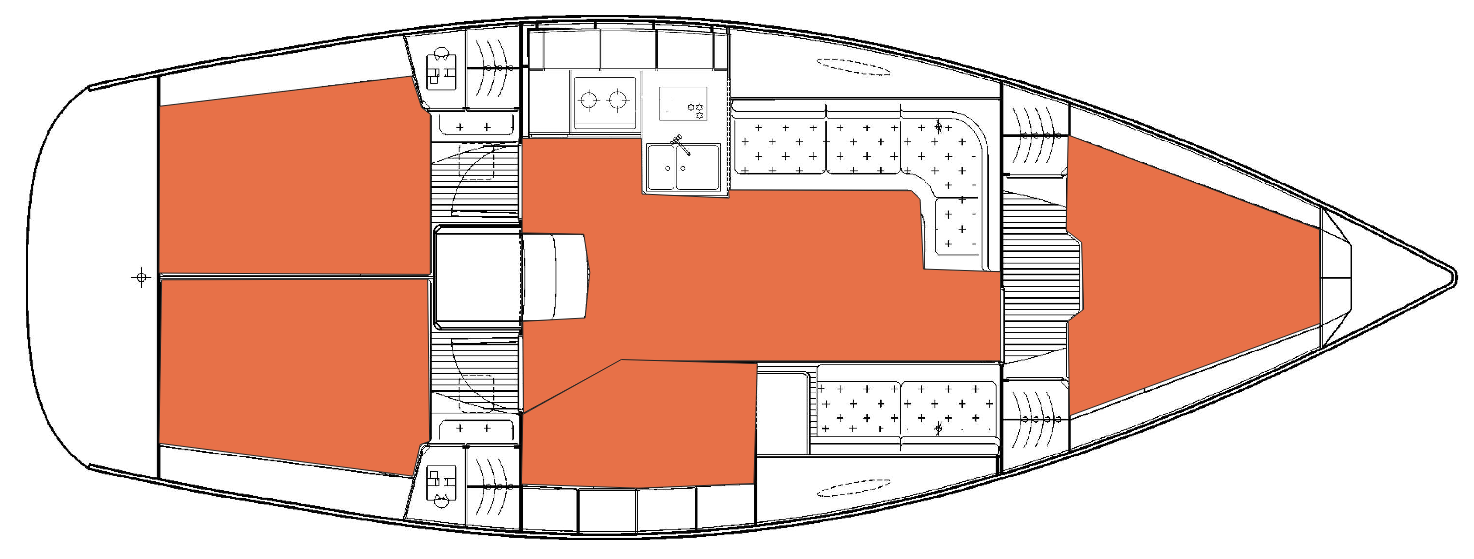
my goal ist to take a custom floor plan (in this example a sailboat) and mark the contained rooms in that plan so i can address them in Qlik Sense.
Both, the floor plan and that geo-data i would like to use in a Qlik Sense Map chart to display kpi data on it.
Important: Behind thy created room-shapes i have to display the original floorplan as a background.
Example of a visual end result is attached (endresult.png).
What i did so far:
1. i downloaded QGIS, imported my floorplan and defined the rooms as polygons on it
2. i exported the polygon data as KML coordinates
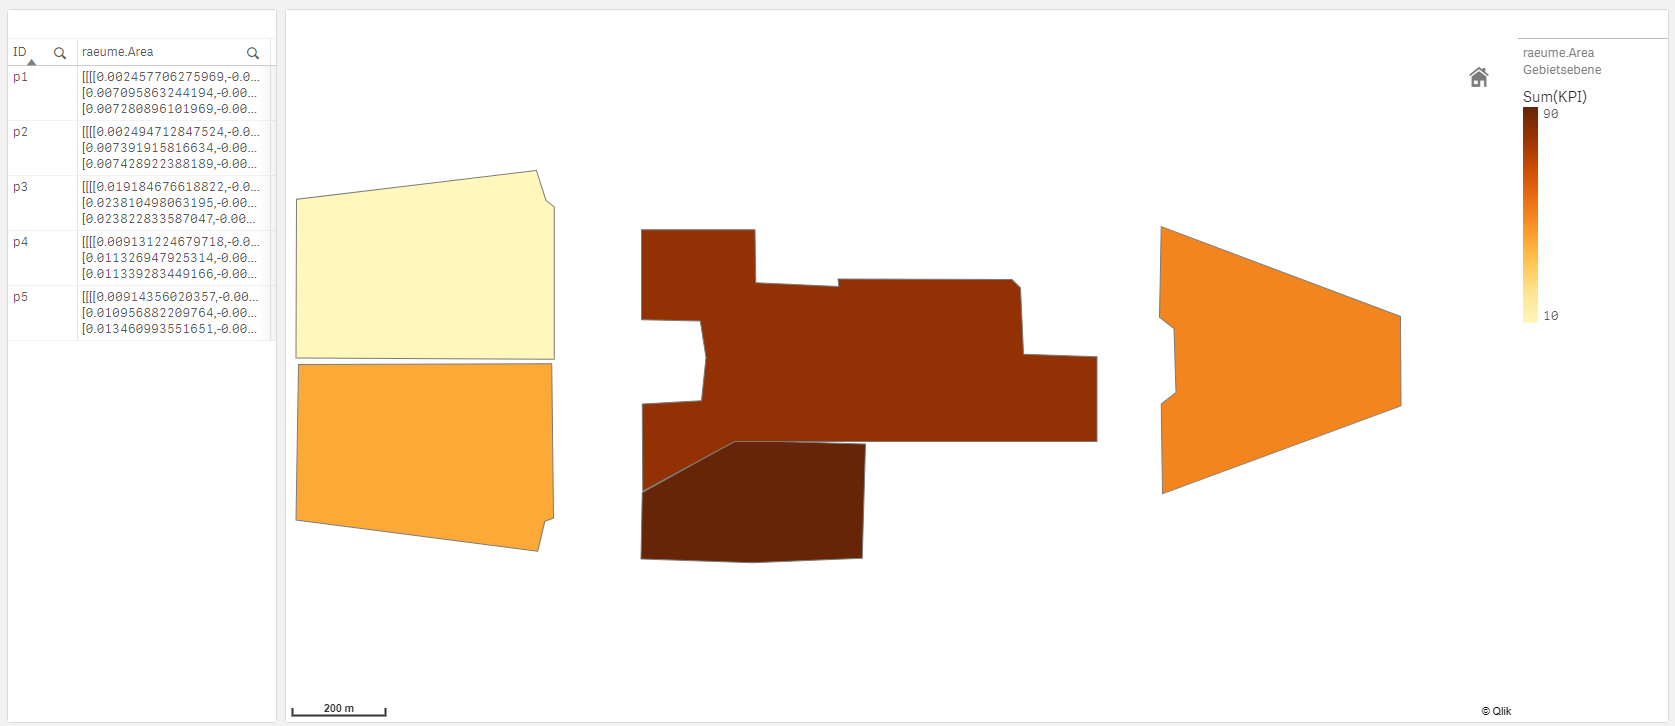
3. i created a sense app, imported KML data and kpi dummy data, took a map chart, created an area layer and set the data points
The KML data and connected kpi data are displayed correctly (sense_map_without_bg.png).
So far so good ...
My problem is now to display the backgound in the right position behind the KML data.
When i create a background layer and set my floorplan as an image, they dont match in any way (zoom and location).
I guess that is understandable since Qlik doesnt now how to match them.
I wonder now what i can do to make them be displayed correctly to each other like show in endresult.png.
Would be very gald for some advice.
Thanks a lot!
- Tags:
- map