Unlock a world of possibilities! Login now and discover the exclusive benefits awaiting you.
- Qlik Community
- :
- Forums
- :
- Analytics & AI
- :
- Products & Topics
- :
- App Development
- :
- Re: Month Vs Rollign 12 months in combo chart
- Subscribe to RSS Feed
- Mark Topic as New
- Mark Topic as Read
- Float this Topic for Current User
- Bookmark
- Subscribe
- Mute
- Printer Friendly Page
- Mark as New
- Bookmark
- Subscribe
- Mute
- Subscribe to RSS Feed
- Permalink
- Report Inappropriate Content
Month Vs Rollign 12 months in combo chart
Hi all,
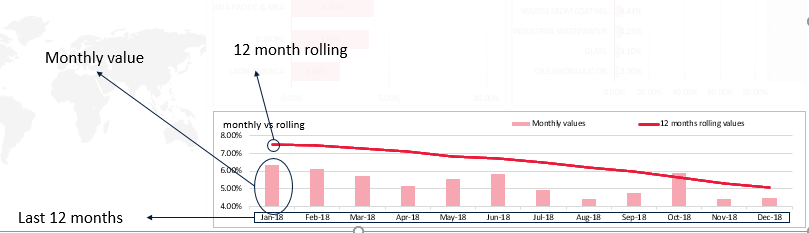
I have requirement to have a combo chart with month-wise date vs 12 months rolling. attached the screenshot.
the screenshot dimension has to be the last 12 months and the bar has to be month-wise data and line or dot has to be 12 months rolling.
I have achieved the dimension and month-wise data but the rolling 12 months not happening
example
dim have last 12 months Jan18-dec 18-> this is achived by selecting the limitation--> fixed number--> top as 12 .
exp 1 has been achieved based on the period I select.
if(GetFieldSelections(Period)='12 Months Rolling',
sum({<Month_Year1={"$(vPeriodType)"},Month=,Year=>}[ Quantity]),
if(GetFieldSelections(Period)='YTD',
sum({<Month_Year1={"$(vPeriodType)"},Month=,Year=>}[ Quantity]),,
if(GetFieldSelections(Period)='Monthly',
sum({<Month_Year1={"$(vPeriodType)"},Month=,Year=>}[ Quantity])
)))
where my variable value is
=if(GetFieldSelections(Period)='12 Months Rolling',
'<=$(=Date(MAX(Month_Year1),'MMM-YY')) >=$(=Date(AddMonths(MAX(Month_Year1),-11),'MMM-YY'))',
if(GetFieldSelections(Period)='YTD',
'<=$(=Date(MAX(Month_Year1),'MMM-YY')) >=$(=Date(YearStart(MAX(Month_Year1)),'MMM-YY'))',
if(GetFieldSelections(Period)='Monthly',
'<=$(=Date(MAX(Month_Year1),'MMM-YY')) >=$(=Date(MonthStart(MAX(Month_Year1)),'MMM-YY'))')))
exp 2 as a line chart is not achievable where Jan 18 dimension value shd have the data from feb17-jan18 as 12 months rolling and similarly to the Feb 18 as mar17-feb18.
exp 2 is not achievable. pls suggest and help me how to achieve the 12 months rolling in this scenario.
Regards
Mano
- « Previous Replies
-
- 1
- 2
- Next Replies »
Accepted Solutions
- Mark as New
- Bookmark
- Subscribe
- Mute
- Subscribe to RSS Feed
- Permalink
- Report Inappropriate Content
You were putting limits on your dimension... see attached
- Mark as New
- Bookmark
- Subscribe
- Mute
- Subscribe to RSS Feed
- Permalink
- Report Inappropriate Content
Hi all,
waiting for your valuable response.
- Mark as New
- Bookmark
- Subscribe
- Mute
- Subscribe to RSS Feed
- Permalink
- Report Inappropriate Content
Do you have The As-Of Table created in your script? If you do you can use that or you can use RangeSum with Above
- Mark as New
- Bookmark
- Subscribe
- Mute
- Subscribe to RSS Feed
- Permalink
- Report Inappropriate Content
Hi Sunny,
Many thanks for the Response.
I didn't use "as of now" since its single simple excel table and attached the sample.
I tried with range sum above function for the second expression(Dot or line chart), but it's not working since it considering the dimension and I tried avoiding the dimension again it's not showing the correct value.
exp2:
=RangeSum(Above( total Sum( [Quantity]),0,12))
what happening is jan2019 should has the value from Feb 2018 to jan2019 but it's taking only Jan2019 as starting value
script is below
T1:
load *,
date(date#(Month_Year,'MMM-YY'),'MMM-YY') as Month_Year1;
LOAD
Year(date#("Reporting Year",'YY')) as Year,
date(date#("Reporting Period",'MMM'),'MMM') as Month,
date(date#("Reporting Period",'MMM'),'MMM')&'-'&Year(date#("Reporting Year",'YY')) as Month_Year,
Quantity from xxx path.
Period_Type:
Load * Inline
[
Period
12 Months Rolling
YTD
Monthly
];
chart is combo
dim is
date(Month_Year1,'MMM-YY')->last 12 months
exp 2 as a dot or line above mentioned and
exp1 as a bar and its month-wise data and variable already explained.
please help me with this exp 2 to achive it.
- Mark as New
- Bookmark
- Subscribe
- Mute
- Subscribe to RSS Feed
- Permalink
- Report Inappropriate Content
Seems to be working here

- Mark as New
- Bookmark
- Subscribe
- Mute
- Subscribe to RSS Feed
- Permalink
- Report Inappropriate Content
sorry sunny, let me give with revised sample data file which has 2017,2018 & 19 data.
- Mark as New
- Bookmark
- Subscribe
- Mute
- Subscribe to RSS Feed
- Permalink
- Report Inappropriate Content
Hi Sunny,
Attached my qvf file where the Jan 2019(exp2) starting point has 72.9 it has only Jan19 month value(this is the roadblock), but it should have sum of value-form feb18 to Jan 19, this will have a clear picture to you. kindly help me with this
- Mark as New
- Bookmark
- Subscribe
- Mute
- Subscribe to RSS Feed
- Permalink
- Report Inappropriate Content
What was the issue with the previous one?
- Mark as New
- Bookmark
- Subscribe
- Mute
- Subscribe to RSS Feed
- Permalink
- Report Inappropriate Content
You were putting limits on your dimension... see attached
- Mark as New
- Bookmark
- Subscribe
- Mute
- Subscribe to RSS Feed
- Permalink
- Report Inappropriate Content
many Thanks, sunny for your solution it's a great help
I implemented the same, the values are getting accurate.
But facing one more issue, I m getting the dimension value from Jan 2017 to Dec 2019, I avoided the dim limit as per your qvf and given no limitation and data handling disabled the include zero values but it's coming with Jan 2017 to Dec 2019. kindly help me with this so that my requirement will be accurate.
- « Previous Replies
-
- 1
- 2
- Next Replies »