Unlock a world of possibilities! Login now and discover the exclusive benefits awaiting you.
- Qlik Community
- :
- Forums
- :
- Analytics & AI
- :
- Products & Topics
- :
- App Development
- :
- Need duration to be displayed in timeline chart
- Subscribe to RSS Feed
- Mark Topic as New
- Mark Topic as Read
- Float this Topic for Current User
- Bookmark
- Subscribe
- Mute
- Printer Friendly Page
- Mark as New
- Bookmark
- Subscribe
- Mute
- Subscribe to RSS Feed
- Permalink
- Report Inappropriate Content
Need duration to be displayed in timeline chart
Hi,
In a bar chart used one regular dimension and a value list ( (i.e) - ValueList('StartDate','FinishDate ) under dimensions and in measures used below expression
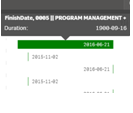
It displays a date value way far behind as in screen below, but Need to display duration of days on Mouse over in bar chart for timeline.
if(ValueList('StartDate','FinishDate')='FinishDate',
max(DayEnd(FinishDate))-Min(DayStart(StartDate))
,Min(daystart(StartDate))
)
Any advice would be appreciated?
Regards,
Radhakrishnan
- Mark as New
- Bookmark
- Subscribe
- Mute
- Subscribe to RSS Feed
- Permalink
- Report Inappropriate Content
Try adding some formating:
if(ValueList('StartDate','FinishDate')='FinishDate',
Interval(max(DayEnd(FinishDate))-Min(DayStart(StartDate)),'d')
,Date(Min(daystart(StartDate)),'YYYY-MM-DD')
)
And set the Number formatting option of the measure to Auto.
talk is cheap, supply exceeds demand
- Mark as New
- Bookmark
- Subscribe
- Mute
- Subscribe to RSS Feed
- Permalink
- Report Inappropriate Content
thanks Gysbert, it works well in Timeline chart extension.
i'm creating Timeline in bar chart, since the dimension used is a drill down object. Then this expression does not work. Any suggestion?
- Mark as New
- Bookmark
- Subscribe
- Mute
- Subscribe to RSS Feed
- Permalink
- Report Inappropriate Content
Please post a small qlikview document that demonstrates the problem.
talk is cheap, supply exceeds demand
- Mark as New
- Bookmark
- Subscribe
- Mute
- Subscribe to RSS Feed
- Permalink
- Report Inappropriate Content
attached qvf and sample data to the application. Need below chart in sheet to display the duration of days on each bar
- Mark as New
- Bookmark
- Subscribe
- Mute
- Subscribe to RSS Feed
- Permalink
- Report Inappropriate Content
Ok, I understand what you want. Afaik this is not possible with the bar chart.
talk is cheap, supply exceeds demand