Unlock a world of possibilities! Login now and discover the exclusive benefits awaiting you.
- Qlik Community
- :
- Forums
- :
- Analytics & AI
- :
- Products & Topics
- :
- App Development
- :
- Re: Pie Chart with 2 Measures?
- Subscribe to RSS Feed
- Mark Topic as New
- Mark Topic as Read
- Float this Topic for Current User
- Bookmark
- Subscribe
- Mute
- Printer Friendly Page
- Mark as New
- Bookmark
- Subscribe
- Mute
- Subscribe to RSS Feed
- Permalink
- Report Inappropriate Content
Pie Chart with 2 Measures?
Hello everyone,
first of all: I am so happy to have this community, because otherwise I would probably start hating my work. So, a huge thank you to everyone here who keeps answering questions and trying to help people make sense of this program. I'm having a terrible day, so I'm sorry for any unhappy sentiments towards Qlik.
Now to my sad little problem:
I'm working on translating a Qlik View App to Qlik Sense right now. One of the charts is a pie chart containing two measures, which, sadly but obviously, doesn't work in Qlik Sense.
This is what the measures do:
= num(
count(
distinct
IF(Interest_Rate = 0
AND End_Date-1 = To_Date AND Row_Nr=1, LoanID&PartID)
)
)
The second one just checks whether the Interest Rate is NOT 0. So it's just looking for equals vs. is different.
I tried pasting that into a QSense pie chart dimension, but there I'm getting a random "Invalid dimension" error (isn't it great how Qlik Sense, in contrast to programs like R or Python, doesn't tell you what the problem is or where it is, just that there is one?).
I've already looked around here and seen that people use the Aggr function to avoid..something..(?) that makes it report the 'Invalid dimension' error, but I can't get that to work either - I've seen people put in a new field at the end of the expressions, and I don't know what the specific field is supposed to be. (Like here: Aggr(If(Count(DISTINCT EMAIL) > 3, '4 and more', '3 and less'), Client) from https://community.qlik.com/thread/226408)
I would be so grateful for some thoughts & tips as to how I can get this stupid pie chart to work!
Thank you everyone 
Cinta
- « Previous Replies
-
- 1
- 2
- Next Replies »
- Mark as New
- Bookmark
- Subscribe
- Mute
- Subscribe to RSS Feed
- Permalink
- Report Inappropriate Content
Hi Omar,
here you go!
I hope this works.
- Mark as New
- Bookmark
- Subscribe
- Mute
- Subscribe to RSS Feed
- Permalink
- Report Inappropriate Content
For the sample provided, is there no place where Interest Rate = Interest Component? If not, then try this
Dimension
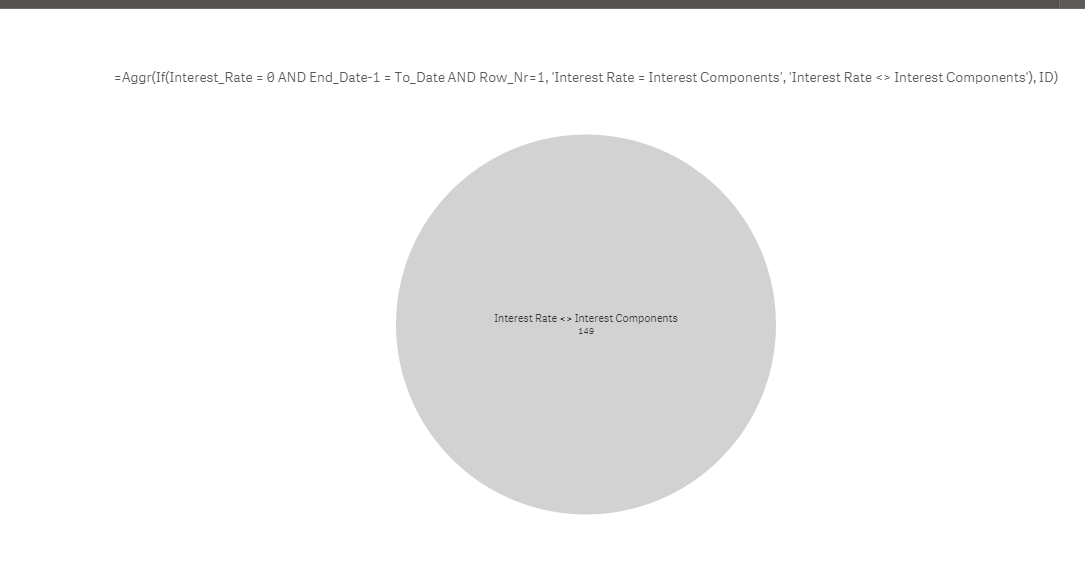
=Aggr(If(Interest_Rate = 0 AND End_Date-1 = To_Date AND Row_Nr=1, 'Interest Rate = Interest Components', 'Interest Rate <> Interest Components'), ID)
Expression
=Count(DISTINCT ID)
- Mark as New
- Bookmark
- Subscribe
- Mute
- Subscribe to RSS Feed
- Permalink
- Report Inappropriate Content
Hi Sunny,
first of all, thank you for the quick reply! The test data is just data I generated randomly since I have no insight into the actual data (it has about 2,5 million rows and I can't safely open it on my laptop), so I'm guessing there are cases where it's = or <>.
Does that make a difference for the formula?
- Mark as New
- Bookmark
- Subscribe
- Mute
- Subscribe to RSS Feed
- Permalink
- Report Inappropriate Content
It should, can you try out the expression for your real scenario?
- Mark as New
- Bookmark
- Subscribe
- Mute
- Subscribe to RSS Feed
- Permalink
- Report Inappropriate Content
Hi, this is what happened with the real data:


The only thing worrying me here is that it's gray and it doesn't show a number of cases. Is that okay?
- Mark as New
- Bookmark
- Subscribe
- Mute
- Subscribe to RSS Feed
- Permalink
- Report Inappropriate Content
Did you use the expression Count(DISTINCT ID)?
- Mark as New
- Bookmark
- Subscribe
- Mute
- Subscribe to RSS Feed
- Permalink
- Report Inappropriate Content
Yes, of course! Dutifully applied everything.
- Mark as New
- Bookmark
- Subscribe
- Mute
- Subscribe to RSS Feed
- Permalink
- Report Inappropriate Content
Not sure what setting it might be, but I see it
- Mark as New
- Bookmark
- Subscribe
- Mute
- Subscribe to RSS Feed
- Permalink
- Report Inappropriate Content
Hmm Well, I'm leaving it like this for now, that's something at least! Thank you so much for your help
- « Previous Replies
-
- 1
- 2
- Next Replies »