Unlock a world of possibilities! Login now and discover the exclusive benefits awaiting you.

- Qlik Community
- :
- Forums
- :
- Analytics & AI
- :
- Products & Topics
- :
- App Development
- :
- Re: Pivot Table: Only show values for specific Dim...
- Subscribe to RSS Feed
- Mark Topic as New
- Mark Topic as Read
- Float this Topic for Current User
- Bookmark
- Subscribe
- Mute
- Printer Friendly Page

 etrotter
- Mark as New
- Bookmark
- Subscribe
- Mute
- Subscribe to RSS Feed
- Permalink
- Report Inappropriate Content
Pivot Table: Only show values for specific Dimensions
Hi Qlikers,
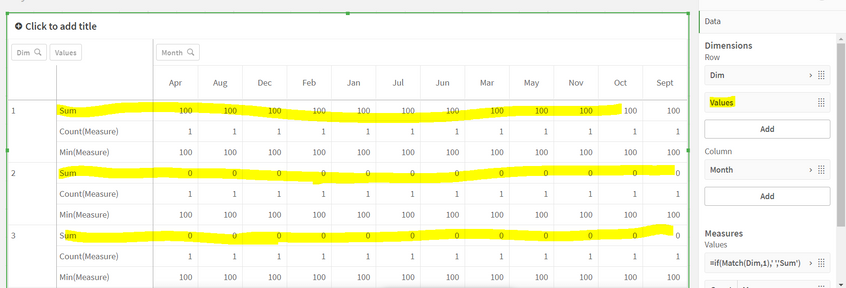
I'm trying to create a pivot table where the measure values only show up for certain row-level dimensions. In the example below, I would like the "Sum" to only show for dim "1" rather than appearing in 2 & 3. I am currently using set analysis, but I've tried conditional show. I would like to stay away from if statements as the real chart I'm implementing this have 5+ measures for each dim & 15 different dims.
Is this possible?

 ibdK4evr
- Mark as New
- Bookmark
- Subscribe
- Mute
- Subscribe to RSS Feed
- Permalink
- Report Inappropriate Content
Hi ,
This can be solved by introducing flag values in the data model.
For example
Dimension | Value | flag
1 sum 0
1 count(Measure). 1
1 min(Measure). 1
if flag is there then you can have the flag = {'1'} include in the set expression of your measure , which will eliminate the dimensions that has the flag as 0. Hence for dimension 1 it will show the values count(Measure) and sum(Measure) which has the flag values as 1 and value sum will not be shown since the flag value is 0

 GaryGiles
- Mark as New
- Bookmark
- Subscribe
- Mute
- Subscribe to RSS Feed
- Permalink
- Report Inappropriate Content
Might need more information, but you could create an additional inline table with:
DimCalcs:
Load * inline [
Dim,Calc
1,Sum
1,Count(Measure)
1,Min(Measure)
2,Count(Measure)
2,Min(Measure)
3,Count(Measure)
3,Min(Measure)
];
And then, for your row dimensions, use Dim and Calc.
For your measure, you would use something like this (I don't know what you calculations are):
Pick(Match(Calc,'Sum','Count(Measure)','Min(Measure)'),
Sum(Value),
Count(Value),
Min(Value))
