Unlock a world of possibilities! Login now and discover the exclusive benefits awaiting you.
- Qlik Community
- :
- Forums
- :
- Analytics & AI
- :
- Products & Topics
- :
- App Development
- :
- Re: Qlik Sense Line Chart date dimension continous...
- Subscribe to RSS Feed
- Mark Topic as New
- Mark Topic as Read
- Float this Topic for Current User
- Bookmark
- Subscribe
- Mute
- Printer Friendly Page
- Mark as New
- Bookmark
- Subscribe
- Mute
- Subscribe to RSS Feed
- Permalink
- Report Inappropriate Content
Qlik Sense Line Chart date dimension continous scale grouping does not work
Dear Qlik Fellows.
I need to achieve this:
- Line chart
- Date dimension on X axis
- The whole chart must fit into screen (no scrollbar)
- Date on X axis should group automatically to month/year etc.
The described behavior is called "Time-aware chart", however, it for some reason works inconsistently. Appreciate your input.
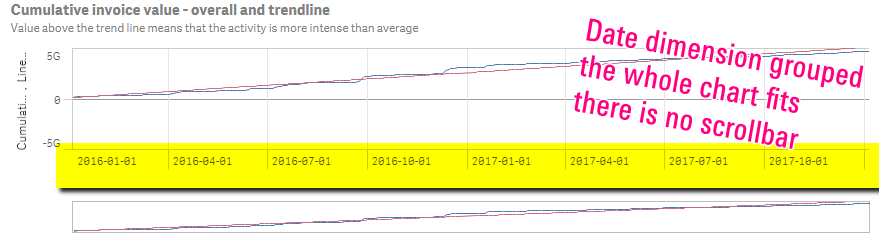
I have this chart already in Document 1, and it works just fine.
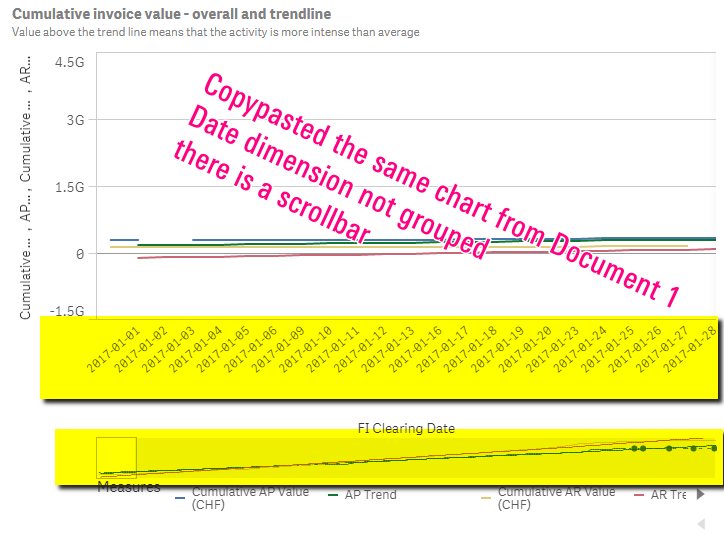
I paste the same chart into Document 2. I replace the initial date dimension with another date dimension (which in principle has a similar date range 2017-2018). And the X axis is not continuous anymore. And there is no date grouping anymore.
I tagged all date fields with tags $date and $day. Still not working.
Where is the trick?
Thank you,
Igor Zhilin.
Accepted Solutions
- Mark as New
- Bookmark
- Subscribe
- Mute
- Subscribe to RSS Feed
- Permalink
- Report Inappropriate Content
Solved quickly, but using a method which I don't completely understand.
I added this line to the script to coerce all fields to be tagged as date:
Tag Fields '*Date*' With $numeric, $integer, $timestamp, $date, $day;
This did the trick.
However, I don't get it, why do I need to assign these tags manually to the columns that already come from a database where they have "date" datatype. If you have any clues on Qlik's field tagging, I would really appreciate your input.