Unlock a world of possibilities! Login now and discover the exclusive benefits awaiting you.
- Qlik Community
- :
- Forums
- :
- Analytics & AI
- :
- Products & Topics
- :
- App Development
- :
- Re: Qlik Sense - Set Analysis Ignore field does no...
- Subscribe to RSS Feed
- Mark Topic as New
- Mark Topic as Read
- Float this Topic for Current User
- Bookmark
- Subscribe
- Mute
- Printer Friendly Page
- Mark as New
- Bookmark
- Subscribe
- Mute
- Subscribe to RSS Feed
- Permalink
- Report Inappropriate Content
Qlik Sense - Set Analysis Ignore field does not work properly
Hey Guys,
Any idea about this strange behavior?
I am using Qlik Sense Nov 2017 Desktop Edition.
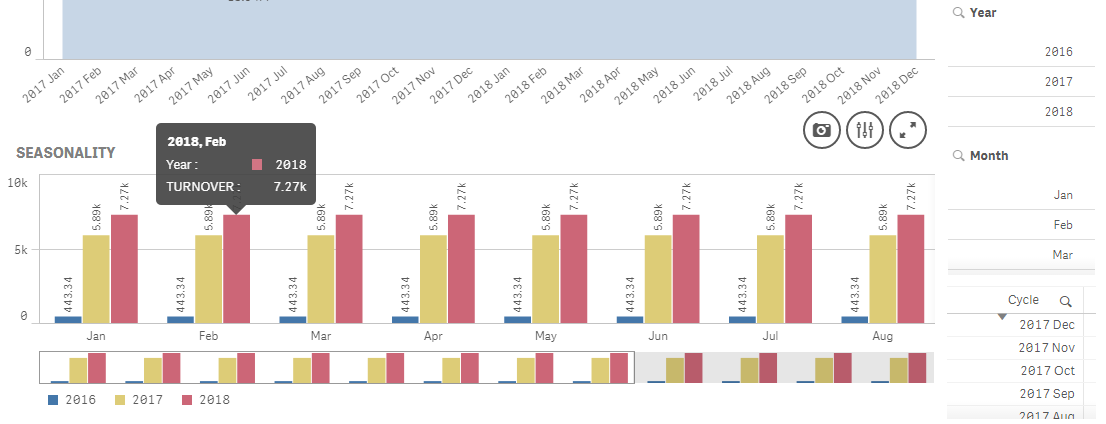
I am using a simple set analysis expression which is sum({$<Year=>} Value*Sign) to ignore selection in year field in the chart SEASONALITY. But it is not working properly. Before selection
After selecting 2017 in Year Field, the legends are gone, the colors of the bars for 2016 and 2018 are gone, and on mouse over the bar, the year is being shown as null. Sum Amounts in Value labels are correct.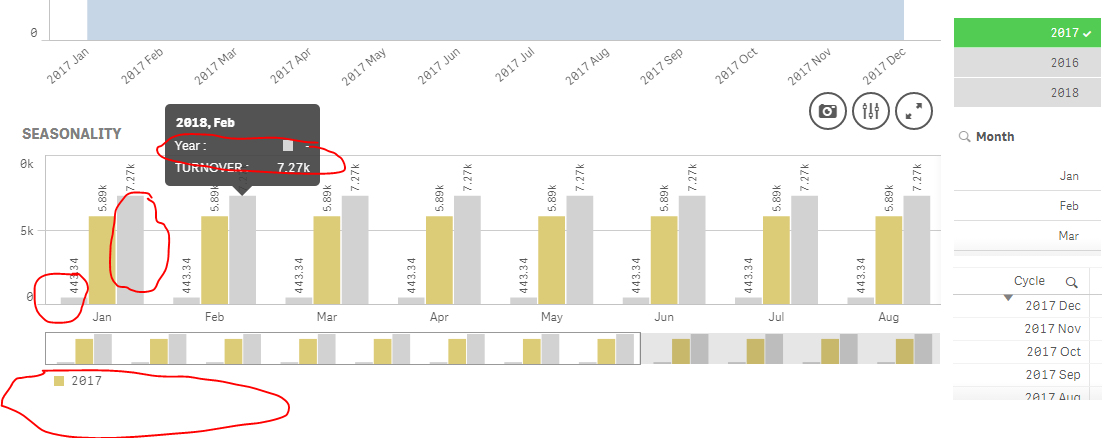
I have used the same data and same expression in Qlikview, it works as expected that nothing at all happens in the chart after making selection in Year field.
Thanks
SAK
- « Previous Replies
-
- 1
- 2
- Next Replies »
- Mark as New
- Bookmark
- Subscribe
- Mute
- Subscribe to RSS Feed
- Permalink
- Report Inappropriate Content
rwunderlich yep, it's exactly the same thing happening with me as you reproduced.
hic mto Hi, can you please look into this challenge as precisely explained and reproduced by Rob.
Thanks
SAK
- Mark as New
- Bookmark
- Subscribe
- Mute
- Subscribe to RSS Feed
- Permalink
- Report Inappropriate Content
Hello Shoaib - you can log a case here and support will get it and review:
Please reference your community discussion URL and Robs files.
Thanks rwunderlich !
Mike Tarallo
Qlik
- Mark as New
- Bookmark
- Subscribe
- Mute
- Subscribe to RSS Feed
- Permalink
- Report Inappropriate Content
I think Qlik Support is for only for customers. I cant login. Can someone please log this case?
Thanks
SAK
- Mark as New
- Bookmark
- Subscribe
- Mute
- Subscribe to RSS Feed
- Permalink
- Report Inappropriate Content
Hi shoaib986,
Did you ever resolved this issue, I'm facing a very similar issue with QV12 SR4, If you have cracked this earlier can you please help me.
Thanks.
- Mark as New
- Bookmark
- Subscribe
- Mute
- Subscribe to RSS Feed
- Permalink
- Report Inappropriate Content
Working fine now in QS cloud. Will try April 2018 QS Desktop now.
It's good in QV12 SR4, I dont face any challenge in QV.
- Mark as New
- Bookmark
- Subscribe
- Mute
- Subscribe to RSS Feed
- Permalink
- Report Inappropriate Content
It's good now every where - QS Cloud, QS Desktop and QV Desktop.
Thanks Qlik Team!
- « Previous Replies
-
- 1
- 2
- Next Replies »