Unlock a world of possibilities! Login now and discover the exclusive benefits awaiting you.
- Qlik Community
- :
- Forums
- :
- Analytics & AI
- :
- Products & Topics
- :
- App Development
- :
- Ranking in Pivot Table (Qlik Sense)
- Subscribe to RSS Feed
- Mark Topic as New
- Mark Topic as Read
- Float this Topic for Current User
- Bookmark
- Subscribe
- Mute
- Printer Friendly Page
- Mark as New
- Bookmark
- Subscribe
- Mute
- Subscribe to RSS Feed
- Permalink
- Report Inappropriate Content
Ranking in Pivot Table (Qlik Sense)
Hello everyone,
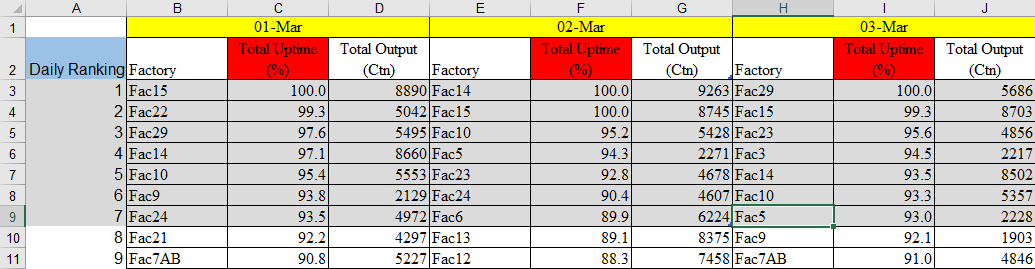
I have a problem where I have to make a pivot table that looks exactly like this .
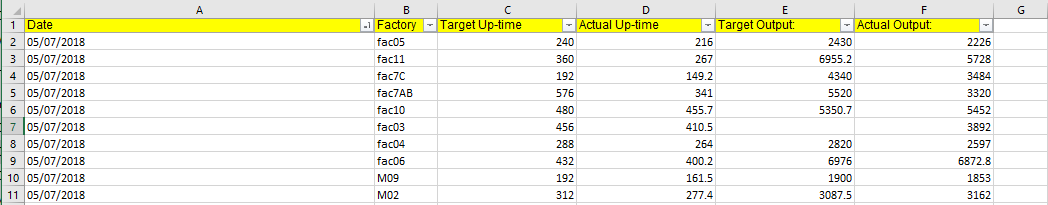
In the raw file, The data looks like this
Requirement :
1) Ranking is calculated based on the total uptime
2) The 1st priority is the output should be as the first image
Calculation :
Total uptime % = (Actual uptime / target uptime) * 100
Total Output = (Actual output/ target output) * 100
Rank (sum((Actual uptime / target uptime) ))
My problem right now :
1) Daily ranking is not exist and unavailable to be put as dimension
2) Factory should logically be the dimension in the pivot table
3) Pivot table in qlik sense cannot be sorted by measure
My current solution :
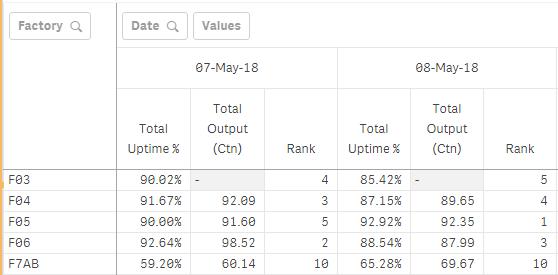
I ranked it using the rank formula. I have not found any other solution so far.
Can someone help me solve this problem? or is it impossible?
Thank you in advance!
- Tags:
- ranking pivot table