Unlock a world of possibilities! Login now and discover the exclusive benefits awaiting you.
- Qlik Community
- :
- Forums
- :
- Analytics & AI
- :
- Products & Topics
- :
- App Development
- :
- scatter plot with customizable data labels
- Subscribe to RSS Feed
- Mark Topic as New
- Mark Topic as Read
- Float this Topic for Current User
- Bookmark
- Subscribe
- Mute
- Printer Friendly Page
- Mark as New
- Bookmark
- Subscribe
- Mute
- Subscribe to RSS Feed
- Permalink
- Report Inappropriate Content
scatter plot with customizable data labels
Hi -
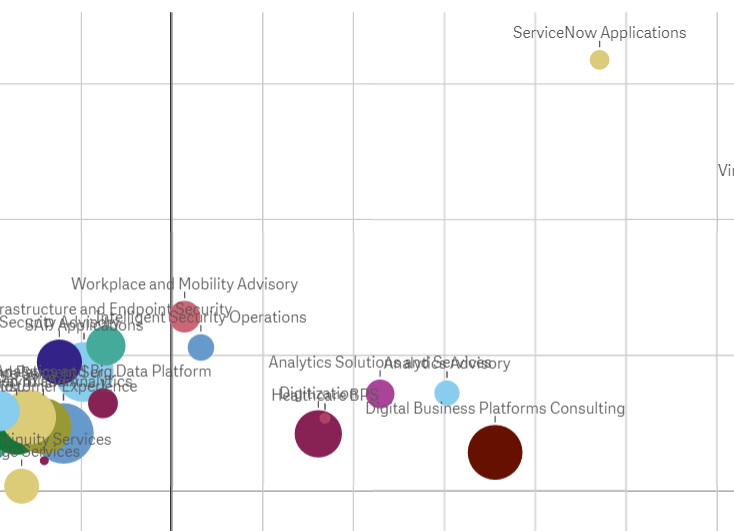
Hoping someone can help with information on a scatter plot where I can move and customize the labels for each bubble. The labels in the default scatter plot overlap. Is there a way to clean this up, without moving the data labels to a legend.
Accepted Solutions
- Mark as New
- Bookmark
- Subscribe
- Mute
- Subscribe to RSS Feed
- Permalink
- Report Inappropriate Content
You would have to do it either in PowerPoint or in Storytelling with labels. I really wouldn't do it that way...Talk as about manual work overload.
You might be able to look into extension objects that solves this for you. Look up Scatterplot object from VizLib.
Best,
Ali A
Få Outlook for Android<https://aka.ms/ghei36>
- Mark as New
- Bookmark
- Subscribe
- Mute
- Subscribe to RSS Feed
- Permalink
- Report Inappropriate Content
Hi,
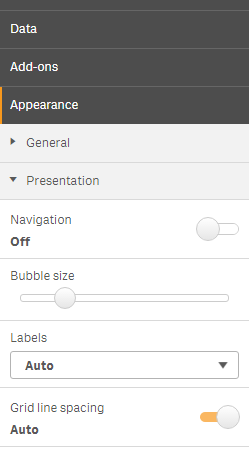
It looks like you have turned off the default option for labels and put them to all isntead of leaving auto? I know all labels don't show up when you have it on auto, but as you zoom in it will.
I would leave it on auto.
Best,
Ali A
- Mark as New
- Bookmark
- Subscribe
- Mute
- Subscribe to RSS Feed
- Permalink
- Report Inappropriate Content
Thank you Ali, this is helpful. Zooming in could help.
The request we have is to export this into Power Point, being able to view all the labels. This would require us to be able to manually move the labels as needed. Is there a way to manually adjust the positioning and of each label?
- Mark as New
- Bookmark
- Subscribe
- Mute
- Subscribe to RSS Feed
- Permalink
- Report Inappropriate Content
Hi,
No that is not possible, unless you want to add them one by one.
Best,
Ali A
Få Outlook for Android<https://aka.ms/ghei36>
- Mark as New
- Bookmark
- Subscribe
- Mute
- Subscribe to RSS Feed
- Permalink
- Report Inappropriate Content
Thank you Ali!
How would I add them one by one? I'm really new at QS.
Thank you,
Brad
- Mark as New
- Bookmark
- Subscribe
- Mute
- Subscribe to RSS Feed
- Permalink
- Report Inappropriate Content
You would have to do it either in PowerPoint or in Storytelling with labels. I really wouldn't do it that way...Talk as about manual work overload.
You might be able to look into extension objects that solves this for you. Look up Scatterplot object from VizLib.
Best,
Ali A
Få Outlook for Android<https://aka.ms/ghei36>
- Mark as New
- Bookmark
- Subscribe
- Mute
- Subscribe to RSS Feed
- Permalink
- Report Inappropriate Content
Thank you Ali
This was very helpful.
Brad