Unlock a world of possibilities! Login now and discover the exclusive benefits awaiting you.
- Qlik Community
- :
- Forums
- :
- Analytics & AI
- :
- Products & Topics
- :
- App Development
- :
- Set Analysis in Bar Chart Measure have no effect o...
- Subscribe to RSS Feed
- Mark Topic as New
- Mark Topic as Read
- Float this Topic for Current User
- Bookmark
- Subscribe
- Mute
- Printer Friendly Page
- Mark as New
- Bookmark
- Subscribe
- Mute
- Subscribe to RSS Feed
- Permalink
- Report Inappropriate Content
Set Analysis in Bar Chart Measure have no effect on Dimension item in Legend
Hello from France!
This is my chart Without set Analysis Dimensions: *Date *STATUT_DEMANDE (giving
Measure Count([ID_RECORD] ) This first chart is Correct | 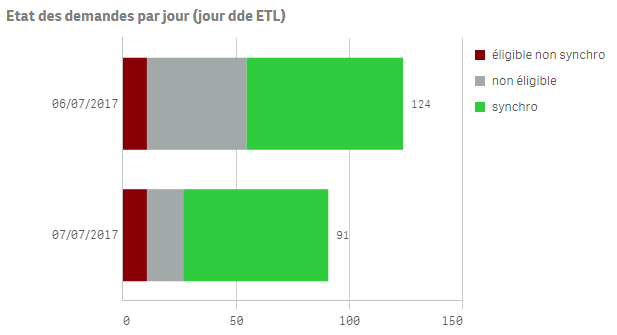 |
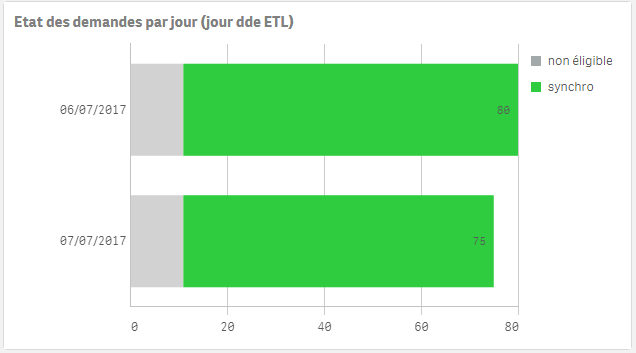
When I change the Measure: Count({<STATUT_DEMANDE = - {"non éligible"}>} [ID_RECORD] ) The grey part has disappeared from the bar but not from the legend! | 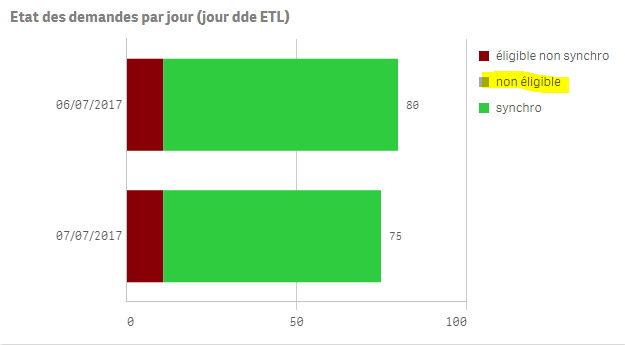 |
And the problem is that I can select the legend The total by Day is the same than selecting the 2 others STATUT_DEMANDE! | 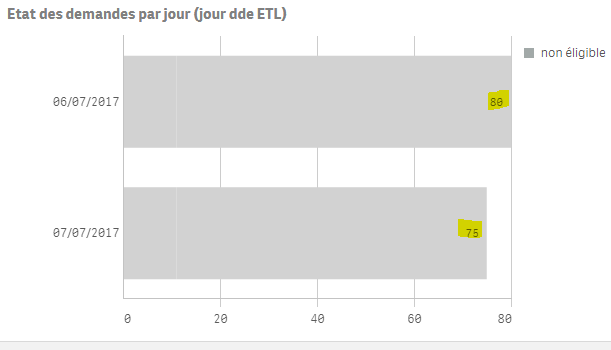 |
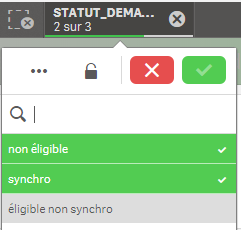
Same problem here and lower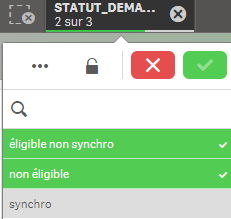 | 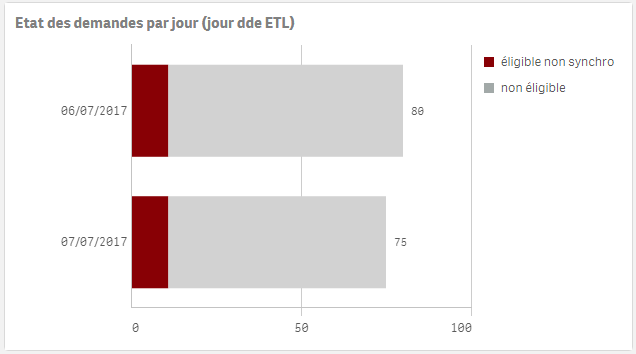 |
 |  |
 )
) . Giving this:
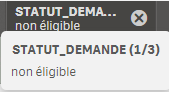
How can I correct this?
Why does my {<STATUT_DEMANDE = - {"non éligible"}>} is not respected??
Thanks
Regards
Martin
- Mark as New
- Bookmark
- Subscribe
- Mute
- Subscribe to RSS Feed
- Permalink
- Report Inappropriate Content
Hi,
what version you are using?
Regards,
Kaushik Solanki
- Mark as New
- Bookmark
- Subscribe
- Mute
- Subscribe to RSS Feed
- Permalink
- Report Inappropriate Content
Hi
I'm using Qlik Sense Desktop June 2017
- Mark as New
- Bookmark
- Subscribe
- Mute
- Subscribe to RSS Feed
- Permalink
- Report Inappropriate Content
Hello Martin!
Please
1. Go to 'Add-ons' > 'Data handling'
2. Uncheck the 'Include Zero Values'
This should remove the excluded value from the legends.
Best Regards
M.Aushik