Unlock a world of possibilities! Login now and discover the exclusive benefits awaiting you.
- Qlik Community
- :
- Forums
- :
- Analytics & AI
- :
- Products & Topics
- :
- App Development
- :
- Re: Setting Conditions in Qlik Sense
- Subscribe to RSS Feed
- Mark Topic as New
- Mark Topic as Read
- Float this Topic for Current User
- Bookmark
- Subscribe
- Mute
- Printer Friendly Page
- Mark as New
- Bookmark
- Subscribe
- Mute
- Subscribe to RSS Feed
- Permalink
- Report Inappropriate Content
Setting Conditions in Qlik Sense
Hello,
I am using Qlik Sense and trying to come up with a solution for the following:
Create a graph or table (to me this does not matter) based on repeat items in the last 7 days.
What I have is a file that is generated with machines ("Press") "Prob code text, Cause code text, and dates through excel and is uploaded using the Data Load Editor.
What I would like is if the date is = today thru 7days ago and the Press, Prob code text and Cause code text are the same then this is shown.
Is there anyway to code these types of conditions into the graph or table.
Here is some examples:
Example 1 would be shown.
Example 2 the Cause code is not the same - no show
Example 3 the date is more than 7 days apart - no show
Example 4 the Prob code text is not the same - no show
Example 5 the Press is not the same - no show
| Example | Malfunct start | Press | Prob code text | Cause code text |
| 1 | 8/1/2018 | CP088 | Loader | Fitting |
| 8/5/2018 | CP088 | Loader | Fitting | |
| 2 | 8/1/2018 | CP122 | Leak - Air | Valve - Solenoid |
| 8/5/2018 | CP122 | Leak - Air | Air Leak | |
| 3 | 7/30/2018 | CP089 | Leak - Air | Valve - Solenoid |
| 8/7/2018 | CP089 | Leak - Air | Valve - Solenoid | |
| 4 | 8/1/2018 | CP088 | Center Mech | Fitting |
| 8/5/2018 | CP088 | Loader | Fitting | |
| 5 | 8/1/2018 | CP069 | Center Mech | Fitting |
| 8/5/2018 | CP072 | Center Mech | Fitting |
Accepted Solutions
- Mark as New
- Bookmark
- Subscribe
- Mute
- Subscribe to RSS Feed
- Permalink
- Report Inappropriate Content
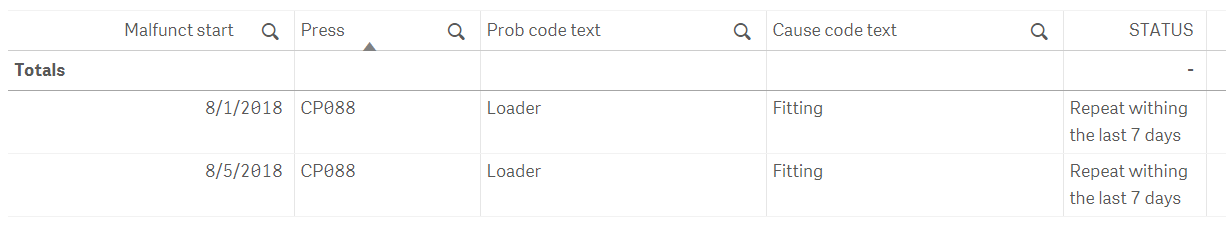
If you prefer to do the filtering directly in the chart and load the entire table into Qlik Sense first then the table in a sheet can use this expression in a measure and label it STATUS:
If( (Above(Press)=Press
AND Above([Prob code text])=[Prob code text]
AND Above([Cause code text])=[Cause code text]
AND Today(1)-[Malfunct start]<=7
AND Today(1)-Above([Malfunct start])<=7)
OR (
Below(Press)=Press
AND Below([Prob code text])=[Prob code text]
AND Below([Cause code text])=[Cause code text]
AND Today(1)-[Malfunct start]<=7
AND Today(1)-Below([Malfunct start])<=7
)
, 'Repeat within the last 7 days' )
Add all the fields as DIMENSIONS. Make sure that the SORTING leaves the [Malfunct start] at the end of the sorting list in the properties of the table. Also go to "Add-ons" and remove the checkmark on the "Include zero values" so you are left with only the rows that have 'Repeat within the last 7 days' and discarding the ones with NULL values.
- Mark as New
- Bookmark
- Subscribe
- Mute
- Subscribe to RSS Feed
- Permalink
- Report Inappropriate Content
You can filter out the matching rows in the load script by doing this:
This script leaves you with a single row containing both the dates instead of two rows...
SET DateFormat='MM/DD/YYYY';


DATA:
LOAD
  *,
  Previous([Malfunct start]) AS [Malfunct start 2]
FROM
  LIB://DATA/ProblemCodes.xlsx (ooxml........)
WHERE
      Previous(Press)=Press
  AND Previous([Prob code text])=[Prob code text]
  AND Previous([Cause code text])=[Cause code text]
  AND Today(1)-[Malfunct start]<=7
  AND Today(1)-Previous([Malfunct start])<=7
;
If you need to have two nearly identical rows with just the differing dates you can add a preceding load to split them into two rows from one row:
SET DateFormat='MM/DD/YYYY';


DATA:
LOAD
  If( IterNo() = 1 , [Malfunct start 2] , [Malfunct start] ) AS [Malfunct start],
  Press,
  [Prob code text],
  [Cause code text]
WHILE
  IterNo()<=2
;
LOAD
  *,
  Previous([Malfunct start]) AS [Malfunct start 2]
FROM
  LIB://DATA/ProblemCodes.xlsx (ooxml........)
WHERE
      Previous(Press)=Press
  AND Previous([Prob code text])=[Prob code text]
  AND Previous([Cause code text])=[Cause code text]
  AND Today(1)-[Malfunct start]<=7
  AND Today(1)-Previous([Malfunct start])<=7
;
- Mark as New
- Bookmark
- Subscribe
- Mute
- Subscribe to RSS Feed
- Permalink
- Report Inappropriate Content
If you prefer to do the filtering directly in the chart and load the entire table into Qlik Sense first then the table in a sheet can use this expression in a measure and label it STATUS:
If( (Above(Press)=Press
AND Above([Prob code text])=[Prob code text]
AND Above([Cause code text])=[Cause code text]
AND Today(1)-[Malfunct start]<=7
AND Today(1)-Above([Malfunct start])<=7)
OR (
Below(Press)=Press
AND Below([Prob code text])=[Prob code text]
AND Below([Cause code text])=[Cause code text]
AND Today(1)-[Malfunct start]<=7
AND Today(1)-Below([Malfunct start])<=7
)
, 'Repeat within the last 7 days' )
Add all the fields as DIMENSIONS. Make sure that the SORTING leaves the [Malfunct start] at the end of the sorting list in the properties of the table. Also go to "Add-ons" and remove the checkmark on the "Include zero values" so you are left with only the rows that have 'Repeat within the last 7 days' and discarding the ones with NULL values.
- Mark as New
- Bookmark
- Subscribe
- Mute
- Subscribe to RSS Feed
- Permalink
- Report Inappropriate Content
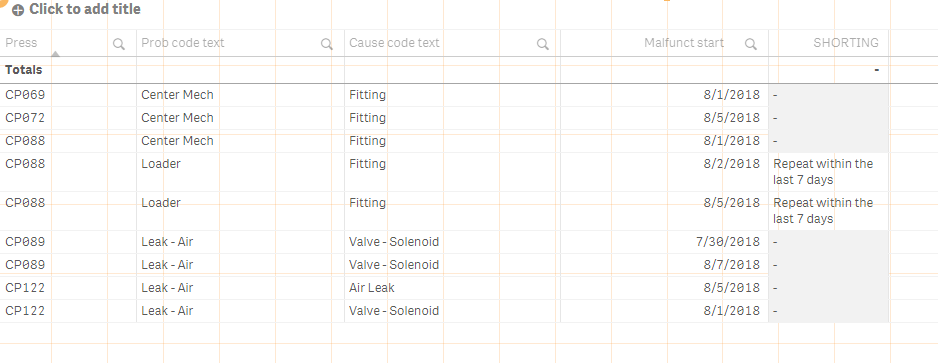
This works exactly as I was wanting! I chose the table option as I use the same data in other areas of my app that I want to display in a different manor.
This is what it looks like prior to taking zero values out:
And this is how it displays after:
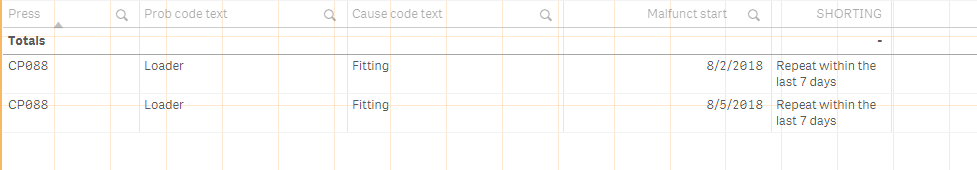
Thank you for the very detailed easy to follow solution!
- Mark as New
- Bookmark
- Subscribe
- Mute
- Subscribe to RSS Feed
- Permalink
- Report Inappropriate Content
You're welcome 
Could you also please close the thread as "answered" by tagging the correct answer as "correct"?