Unlock a world of possibilities! Login now and discover the exclusive benefits awaiting you.
Announcements
Now accepting applications for the Qlik Luminary and Partner Ambassador Programs: Apply by July 6!
- Qlik Community
- :
- Forums
- :
- Analytics & AI
- :
- Products & Topics
- :
- App Development
- :
- Show all dates, even if count() = 0
Options
- Subscribe to RSS Feed
- Mark Topic as New
- Mark Topic as Read
- Float this Topic for Current User
- Bookmark
- Subscribe
- Mute
- Printer Friendly Page
Turn on suggestions
Auto-suggest helps you quickly narrow down your search results by suggesting possible matches as you type.
Showing results for
Creator III
2017-06-21
05:33 AM
- Mark as New
- Bookmark
- Subscribe
- Mute
- Subscribe to RSS Feed
- Permalink
- Report Inappropriate Content
Show all dates, even if count() = 0
Hello, everyone!
When i show counts without any filters i got right graph like this
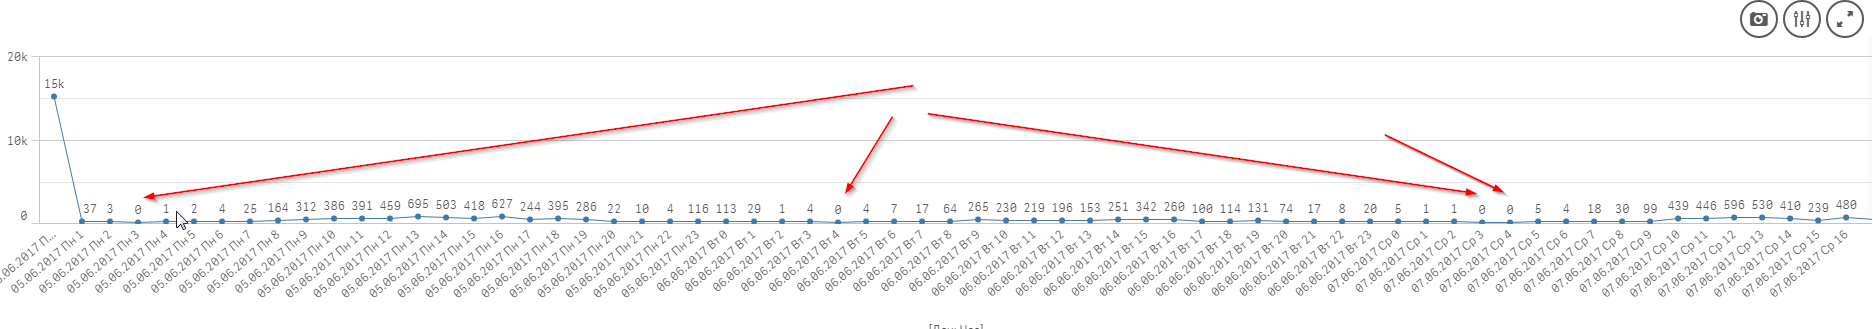
So here everithing is great: i see dates where count can be zero and i see all dates without omissions as i make master calendar (we all make master calendars for this achievement, right?  )
)
Ok.
But when i chose some of my filter that working on data, i miss zero count dates and dimension of dates became incomplete:
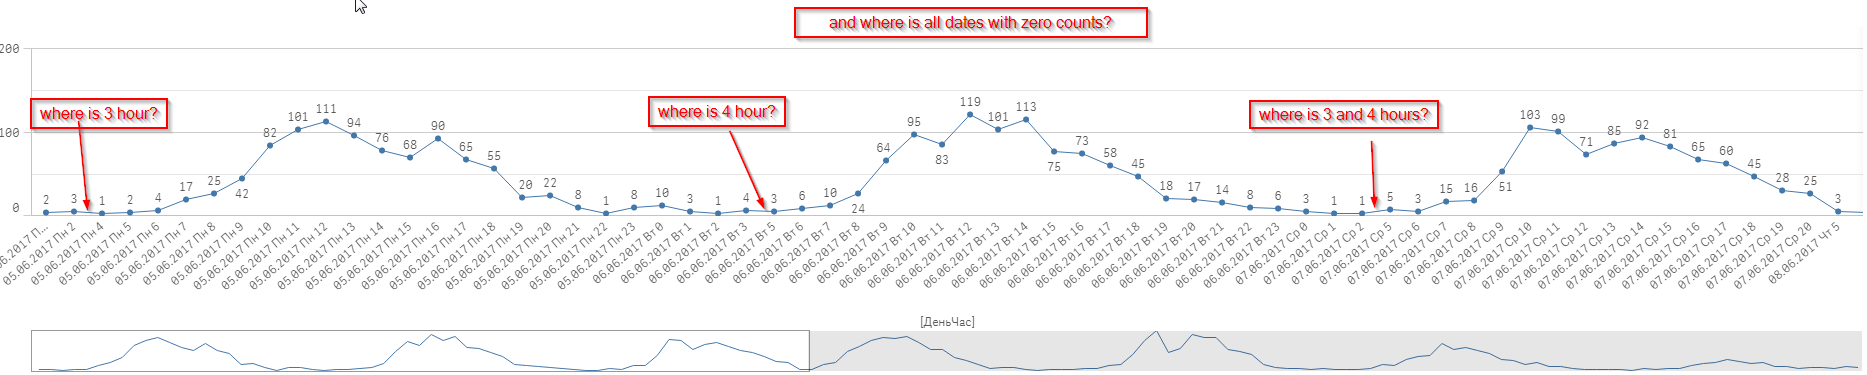
My goal is to show all dates (date + weekday + hour) in every week in year.
457 Views
0 Replies