Unlock a world of possibilities! Login now and discover the exclusive benefits awaiting you.
- Qlik Community
- :
- Forums
- :
- Analytics & AI
- :
- Products & Topics
- :
- App Development
- :
- Re: Stacked Bar Chart Dimension - qlik sense
- Subscribe to RSS Feed
- Mark Topic as New
- Mark Topic as Read
- Float this Topic for Current User
- Bookmark
- Subscribe
- Mute
- Printer Friendly Page
- Mark as New
- Bookmark
- Subscribe
- Mute
- Subscribe to RSS Feed
- Permalink
- Report Inappropriate Content
Stacked Bar Chart Dimension - qlik sense
Hi
I have a stacked bar chart, that shows how many days customers orders process takes...in each department
I wish to use CustomerID as my dimension, but it keeps grouping up the totals
I can use Separate OrderID and its fine, and for example it will then show separate grouped totals for each order... but I want to show e.g show two CustomerID 1 on the dimension axis.
is this possible?
please help
Accepted Solutions
- Mark as New
- Bookmark
- Subscribe
- Mute
- Subscribe to RSS Feed
- Permalink
- Report Inappropriate Content
CustomerID1
CustomerID1
CustomerID2
CustomerID3
CustomerID3
CustomerID3
I can't see why CustomerID1 is different from CustomerID1 and CustomerID1. And neither can Qlik Sense. So you will have to make explicit why CustomerID1 isn't CustomerID1 and isn't CustomerID1 either. In other words: make them unique values.
talk is cheap, supply exceeds demand
- Mark as New
- Bookmark
- Subscribe
- Mute
- Subscribe to RSS Feed
- Permalink
- Report Inappropriate Content
I'm afraid you lost me on the second sentence. Can you post a small qlik sense app that shows what you mean?
but I want to show e.g show two CustomerID 1 on the dimension axis.
You want to use the CustomerID twice as a dimension? Or show the dimension value 1 twice? Neither makes sense to me. An app that illustrates it would be nice.
talk is cheap, supply exceeds demand
- Mark as New
- Bookmark
- Subscribe
- Mute
- Subscribe to RSS Feed
- Permalink
- Report Inappropriate Content
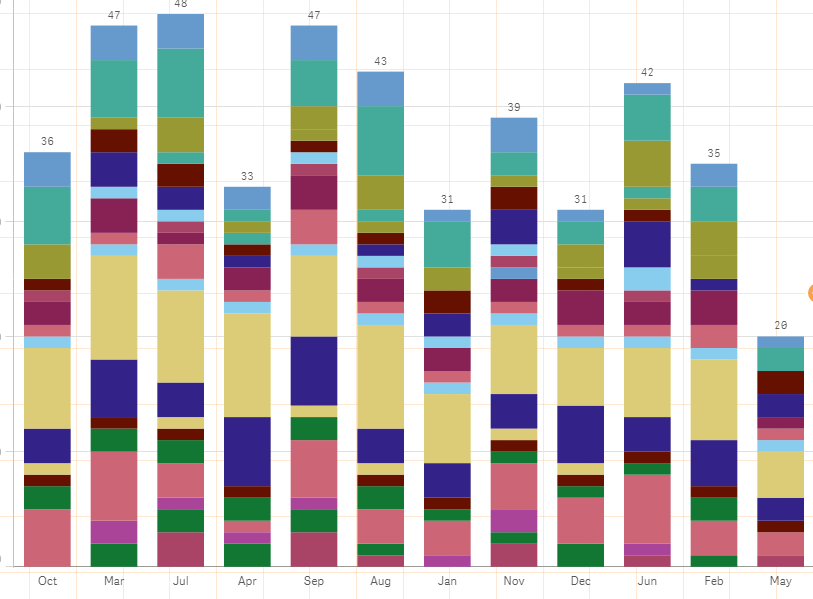
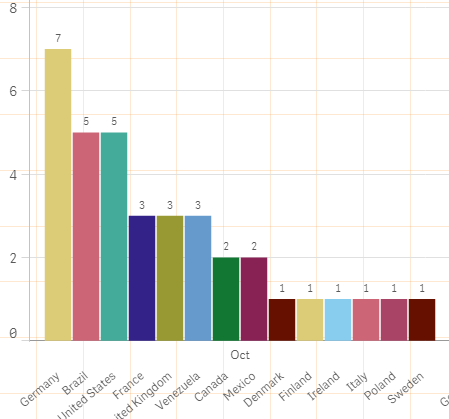
If you are referring to the values showing only a total for a stacked group rather than individual values for each dimension value in a group I'm afraid i don't think its possible just yet. Below i get only monthly totals per stack, below that i get month and country totals
- Mark as New
- Bookmark
- Subscribe
- Mute
- Subscribe to RSS Feed
- Permalink
- Report Inappropriate Content
Hiya
I would like to see each customer
the dimension will look like
CustomerID1
CustomerID1
CustomerID2
CustomerID3
CustomerID3
CustomerID3
The stacked chart groups these as
CustomerID1
CustomerID2
CustomerID3
please help
- Mark as New
- Bookmark
- Subscribe
- Mute
- Subscribe to RSS Feed
- Permalink
- Report Inappropriate Content
CustomerID1
CustomerID1
CustomerID2
CustomerID3
CustomerID3
CustomerID3
I can't see why CustomerID1 is different from CustomerID1 and CustomerID1. And neither can Qlik Sense. So you will have to make explicit why CustomerID1 isn't CustomerID1 and isn't CustomerID1 either. In other words: make them unique values.
talk is cheap, supply exceeds demand
- Mark as New
- Bookmark
- Subscribe
- Mute
- Subscribe to RSS Feed
- Permalink
- Report Inappropriate Content
Hiya
thanx Team
Kind Regards