Unlock a world of possibilities! Login now and discover the exclusive benefits awaiting you.
- Qlik Community
- :
- Forums
- :
- Analytics & AI
- :
- Products & Topics
- :
- App Development
- :
- Table Background Colour Scale Expressions
- Subscribe to RSS Feed
- Mark Topic as New
- Mark Topic as Read
- Float this Topic for Current User
- Bookmark
- Subscribe
- Mute
- Printer Friendly Page
- Mark as New
- Bookmark
- Subscribe
- Mute
- Subscribe to RSS Feed
- Permalink
- Report Inappropriate Content
Table Background Colour Scale Expressions
Hi all,
I'm trying to make a chart similar to the one below within Qlik Sense using background colour expressions but can't see how to get a colour scale.
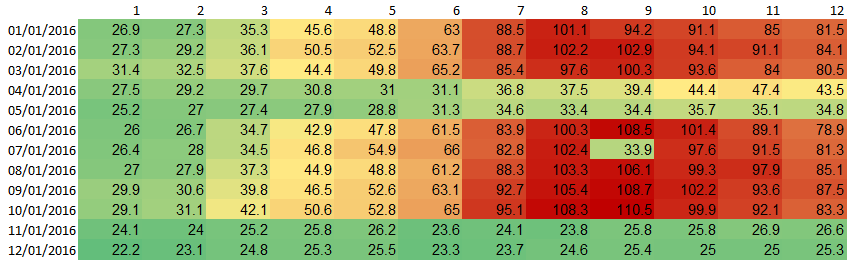
Can anyone provide guidance on how this can be achieved using background colour expressions or any other method please?
Any and all responses much appreciated, thank you.
- Mark as New
- Bookmark
- Subscribe
- Mute
- Subscribe to RSS Feed
- Permalink
- Report Inappropriate Content
It's probably easiest to use the ColorMix wizard in Qlikview to generate the color expression and then copy that expression over to the Qlik Sense app.
talk is cheap, supply exceeds demand
- Mark as New
- Bookmark
- Subscribe
- Mute
- Subscribe to RSS Feed
- Permalink
- Report Inappropriate Content
Hi Sarah,
As Gysbert suggested, make use of the ColorMix wizard in Qlikview to generate an expression and copy it across to Qliksense.
- Mark as New
- Bookmark
- Subscribe
- Mute
- Subscribe to RSS Feed
- Permalink
- Report Inappropriate Content
That's great, thank you Gysbert and Sangram
- Mark as New
- Bookmark
- Subscribe
- Mute
- Subscribe to RSS Feed
- Permalink
- Report Inappropriate Content
Hi all,
I've created an expression using the ColorMix wizard and copied this over to my pivot table in Sense but this only compares values by column, not across the whole table. I've have a date dimension within the rows section and a time dimension within the column section and the background colour expression is applied to the measure.
Does anyone know of a way that the background colour expression can be applied across the whole table, not by column?
Any and all responses much appreciated, thank you.