Unlock a world of possibilities! Login now and discover the exclusive benefits awaiting you.

- Qlik Community
- :
- Forums
- :
- Analytics & AI
- :
- Products & Topics
- :
- App Development
- :
- Re: Table Visualization - show most recent date
- Subscribe to RSS Feed
- Mark Topic as New
- Mark Topic as Read
- Float this Topic for Current User
- Bookmark
- Subscribe
- Mute
- Printer Friendly Page

 jerryr125
- Mark as New
- Bookmark
- Subscribe
- Mute
- Subscribe to RSS Feed
- Permalink
- Report Inappropriate Content
Table Visualization - show most recent date
Hi -
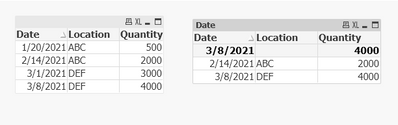
I have the following Table visualization:
| Date | Location | Quantity |
| 1/20/2021 | ABC | 500 |
| 2/14/2021 | ABC | 2000 |
| 3/1/2021 | DEF | 3000 |
| 3/8/2021 | DEF | 4000 |
I would like to Table visualization to only display the most recent date by location.
Therefore, given the example above, the visualization should display the following:
| Date | Location | Quantity |
| 2/14/2021 | ABC | 2000 |
| 3/8/2021 | DEF | 4000 |
thoughts ? Thanks - Jerry
- Tags:
- qlik sense
Accepted Solutions
 salonicdk28
- Mark as New
- Bookmark
- Subscribe
- Mute
- Subscribe to RSS Feed
- Permalink
- Report Inappropriate Content
You just need to take only Location as Dimension and other 2 fields will come in expression
1) Date should be calculated in expression as Date(Max(Date))
2)Quantity=FirstSortedValue(Quantity,-(Date*1000+Quantity))
Please try this way, Hope you get the result
salonicdk28
- Mark as New
- Bookmark
- Subscribe
- Mute
- Subscribe to RSS Feed
- Permalink
- Report Inappropriate Content
Try this-
Dimension- Location
Measure-
Date=Date(Max(Date))
Quantity=FirstSortedValue(Quantity,-(Date*1000+Quantity))
jerryr125
- Mark as New
- Bookmark
- Subscribe
- Mute
- Subscribe to RSS Feed
- Permalink
- Report Inappropriate Content
Hi that did not work unfortunately - It is still displaying multiple dates for each location.
salonicdk28
- Mark as New
- Bookmark
- Subscribe
- Mute
- Subscribe to RSS Feed
- Permalink
- Report Inappropriate Content
You just need to take only Location as Dimension and other 2 fields will come in expression
1) Date should be calculated in expression as Date(Max(Date))
2)Quantity=FirstSortedValue(Quantity,-(Date*1000+Quantity))
Please try this way, Hope you get the result
