Unlock a world of possibilities! Login now and discover the exclusive benefits awaiting you.
- Qlik Community
- :
- Forums
- :
- Analytics & AI
- :
- Products & Topics
- :
- App Development
- :
- Re: Timeline analysis
- Subscribe to RSS Feed
- Mark Topic as New
- Mark Topic as Read
- Float this Topic for Current User
- Bookmark
- Subscribe
- Mute
- Printer Friendly Page
- Mark as New
- Bookmark
- Subscribe
- Mute
- Subscribe to RSS Feed
- Permalink
- Report Inappropriate Content
Timeline analysis
I'm trying to make a timeline graphic by month with dimension being the count of a "x" measure (p.number).
I've already made the MasterCalendar and it works fine but I want the months fixed, so when there is no count values for a month the graphic put it to zero.
I've also tried the options "Show as zeros" (on graphic appearance tab) and unchecked "Include null values".
As a turnaround I created a "fixed" calendar, with all months, but I stucked when trying to separate the count "x" by month.
For each "x" there is a Date associated field (p.gen_date) in which I can validate, but I would not like to create another virtual table, I'd like to filter this directly on the graphic.
--------------
Code for virtual calendar:
FullCalendar:
Let vMin = Num('2017-01-01');
Let vMax = Num('2017-12-31');
Load
If(RowNo() = 1, Date($(vMin), 'YYYY-MM-DD'), Date($(vMin), 'YYYY-MM-DD') + RowNo()) as tDate
AutoGenerate (1) While $(vMin) + RowNo() <= Date($(vMax));
MonthCalendar:
Load
Distinct Month(tDate) as cal_Mês
Resident FullCalendar;
Drop Table FullCalendar;
Sample code for measure values:
generated_process:
select
p.number,
p.gen_date,
p.user,
p.location
from
protocol p
-----------------------
So I've added a lines graphic and put as dimension "cal_Mês" and as measure the function below (which not worked):
Count({$(Month(p.gen_date) = $(cal_Mês))} p.number)
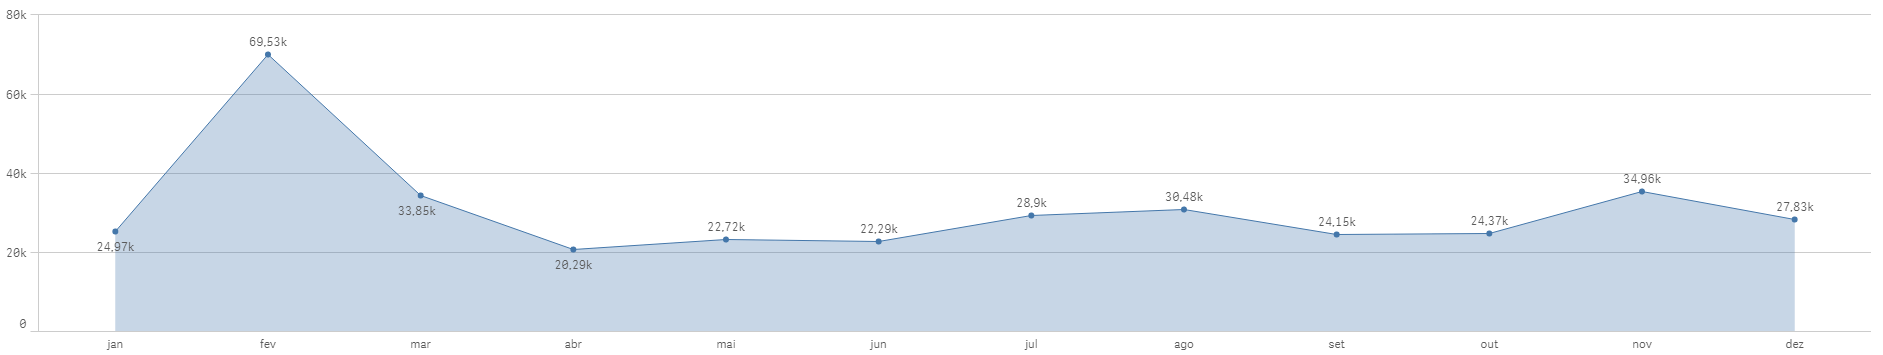
This is what I have with MasterCalendar, but when I apply some filters the months with zero values just dissapear from graphic instead of showing value equals to zero.
Any ideas of solving this with a chart expression (without populating table and without creating a new virtual table)..?
Accepted Solutions
- Mark as New
- Bookmark
- Subscribe
- Mute
- Subscribe to RSS Feed
- Permalink
- Report Inappropriate Content
Use Aggr() to group by month:
Sum(Aggr(Count({$(Month(p.gen_date) = $(cal_Mês))} p.number),Month(p.gen_date))
Assuming you have a calendar as described:
- Mark as New
- Bookmark
- Subscribe
- Mute
- Subscribe to RSS Feed
- Permalink
- Report Inappropriate Content
Use Aggr() to group by month:
Sum(Aggr(Count({$(Month(p.gen_date) = $(cal_Mês))} p.number),Month(p.gen_date))
Assuming you have a calendar as described: