Unlock a world of possibilities! Login now and discover the exclusive benefits awaiting you.
- Qlik Community
- :
- Forums
- :
- Analytics & AI
- :
- Products & Topics
- :
- App Development
- :
- Re: Waterfall Chart doesn't display all values?
- Subscribe to RSS Feed
- Mark Topic as New
- Mark Topic as Read
- Float this Topic for Current User
- Bookmark
- Subscribe
- Mute
- Printer Friendly Page
- Mark as New
- Bookmark
- Subscribe
- Mute
- Subscribe to RSS Feed
- Permalink
- Report Inappropriate Content
Waterfall Chart doesn't display all values?
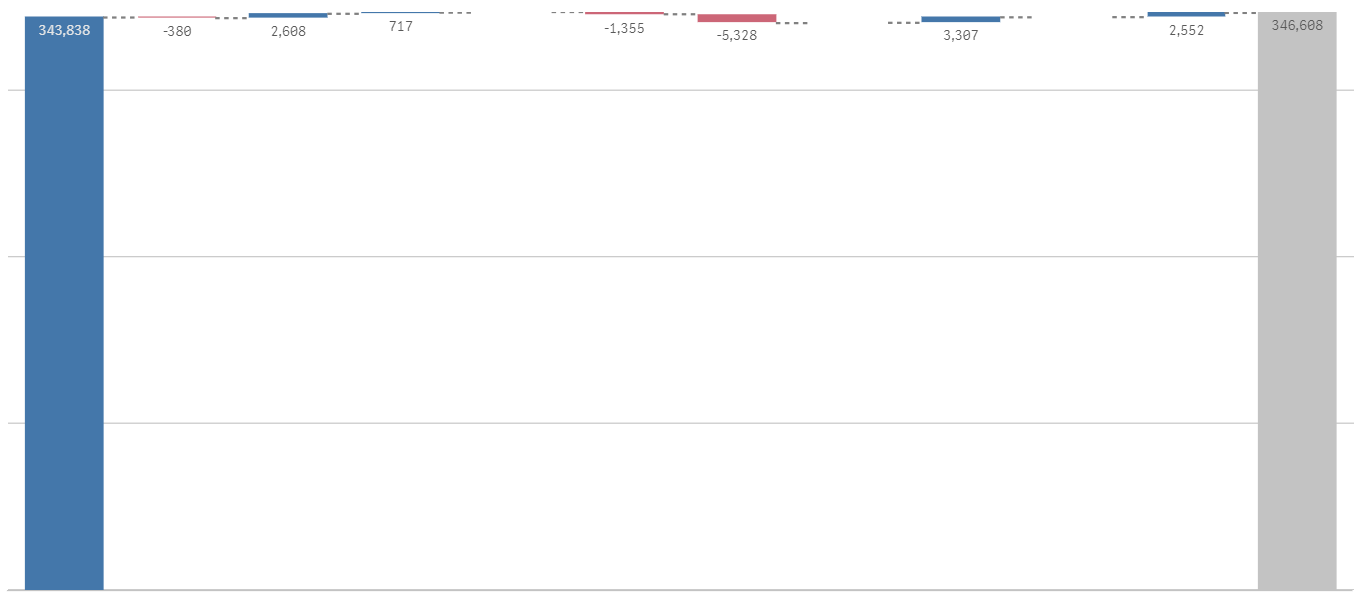
Does anyone have a way to force the waterfall chart from the Sept 2017 release to show all values in the chart? See below. The chart shows different groups of values depending on how I resize it...There doesn't appear to be a rhyme or reason other than the values are all small relative to the totals.
This chart is useless if it won't properly and reliably display the data...
Any help would be much appreciated!
Accepted Solutions
- Mark as New
- Bookmark
- Subscribe
- Mute
- Subscribe to RSS Feed
- Permalink
- Report Inappropriate Content
try restricting the scale of the graph
- Mark as New
- Bookmark
- Subscribe
- Mute
- Subscribe to RSS Feed
- Permalink
- Report Inappropriate Content
try restricting the scale of the graph
- Mark as New
- Bookmark
- Subscribe
- Mute
- Subscribe to RSS Feed
- Permalink
- Report Inappropriate Content
Thanks Giovanne, I had tried that originally with hard-coded min/max, and it didn't work.
Your suggestion reminded me of this option and I tried a dynamic min/max and it worked!
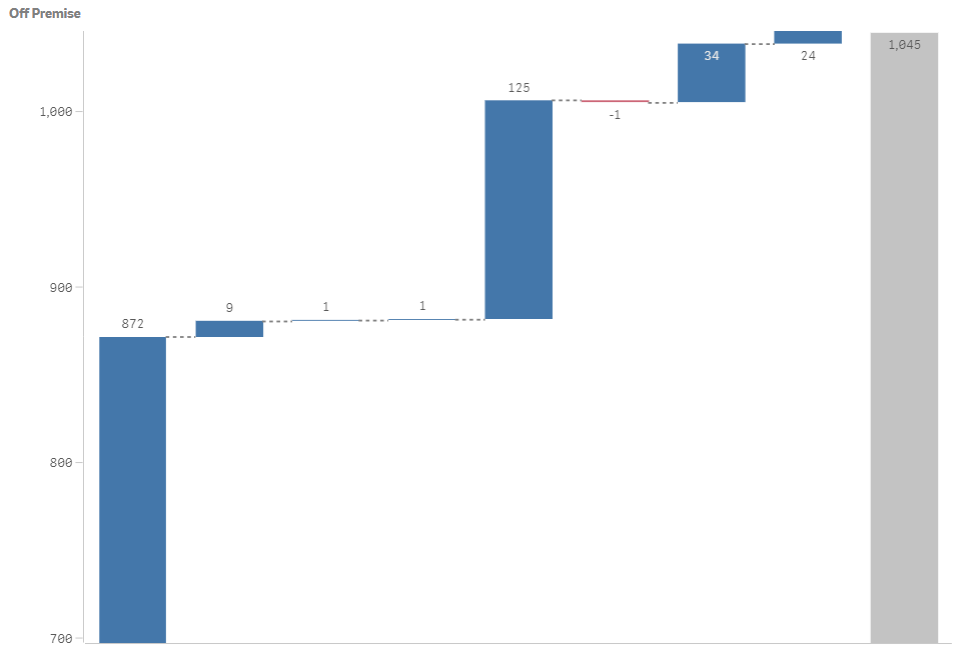
I ended up using sum(Measure)*.8 as the min and sum(measure)*1.2 as the max. Thanks for the memory-jog!