Unlock a world of possibilities! Login now and discover the exclusive benefits awaiting you.

- Qlik Community
- :
- Forums
- :
- Analytics & AI
- :
- Products & Topics
- :
- App Development
- :
- Year breakdown while using multiple dimensions
- Subscribe to RSS Feed
- Mark Topic as New
- Mark Topic as Read
- Float this Topic for Current User
- Bookmark
- Subscribe
- Mute
- Printer Friendly Page

- Mark as New
- Bookmark
- Subscribe
- Mute
- Subscribe to RSS Feed
- Permalink
- Report Inappropriate Content
Year breakdown while using multiple dimensions
Hello,
I am running into an issue with not being able to provide a year to month breakdown while using a 2nd dimension to identify the individual values for UserBU.
Dimension 1 = Year >> Month
Dimension 2 = UserBU
When selecting the Year within the graph, my 2nd dimension is applied as a filter for the dashboard when I would like to have the Year be selected as the filter and also breakdown into months. All while displaying/using the 2nd dimension to identify the individual values for UserBU.



 felipedl
- Mark as New
- Bookmark
- Subscribe
- Mute
- Subscribe to RSS Feed
- Permalink
- Report Inappropriate Content
As I understand, what you need is to create a Drill-Down dimension Ozzie, so once you select a Year, it will go to the Month dimension and the graphs will act accordingly.
See this from help: https://help.qlik.com/en-US/sense/April2018/Subsystems/Hub/Content/Dimensions/create-drill-down-dime...
Felipe.
- Mark as New
- Bookmark
- Subscribe
- Mute
- Subscribe to RSS Feed
- Permalink
- Report Inappropriate Content
I have a drill down currently setup, Year >> Month. The issue I run into is when I select the year within the graph this dimension is used, my 2nd Dimension of UserBU is applied as a filter and then the graph breaks out into months.
What I am trying to do is when the Year is selected within the graph, only the Year value is applied as a filter and not UserBU while still breaking down into months.
felipedl
- Mark as New
- Bookmark
- Subscribe
- Mute
- Subscribe to RSS Feed
- Permalink
- Report Inappropriate Content
Sorry, i'm having a difficult time to grasp the concept  .
.
I've created some dummy data for testing (I just have view installed, but the same concept applies to Sense).
sales:
Load
UserBU,
Value,
Date#(Date,'MM-YYYY') as Year_Month;
Load * Inline
[
UserBU,Value,Date
1,100,01-2018
2,300,01-2018
3,1044,01-2018
4,103,01-2018
7,1033,02-2018
1,330,02-2018
3,105,01-2018
6,300,04-2018
1,100,06-2018
8,1100,05-2018
5,130,03-2018
3,550,02-2018
1,100,04-2018
2,300,05-2018
2,300,12-2017
];


let vMinDate = Num(MakeDate(2017,12));
let vMaxDate = Num(MakeDate(2018,6));


calendar:
Load
Num_Date,
Date(MonthStart(Num_Date),'MM-YYYY') as Year_Month,
Year(Num_Date) as Year;
Load
$(vMinDate) + IterNo() as Num_Date
AutoGenerate(1) while $(vMinDate) + IterNo() <= $(vMaxDate);
So this will only generate a calendar and some dummy data.
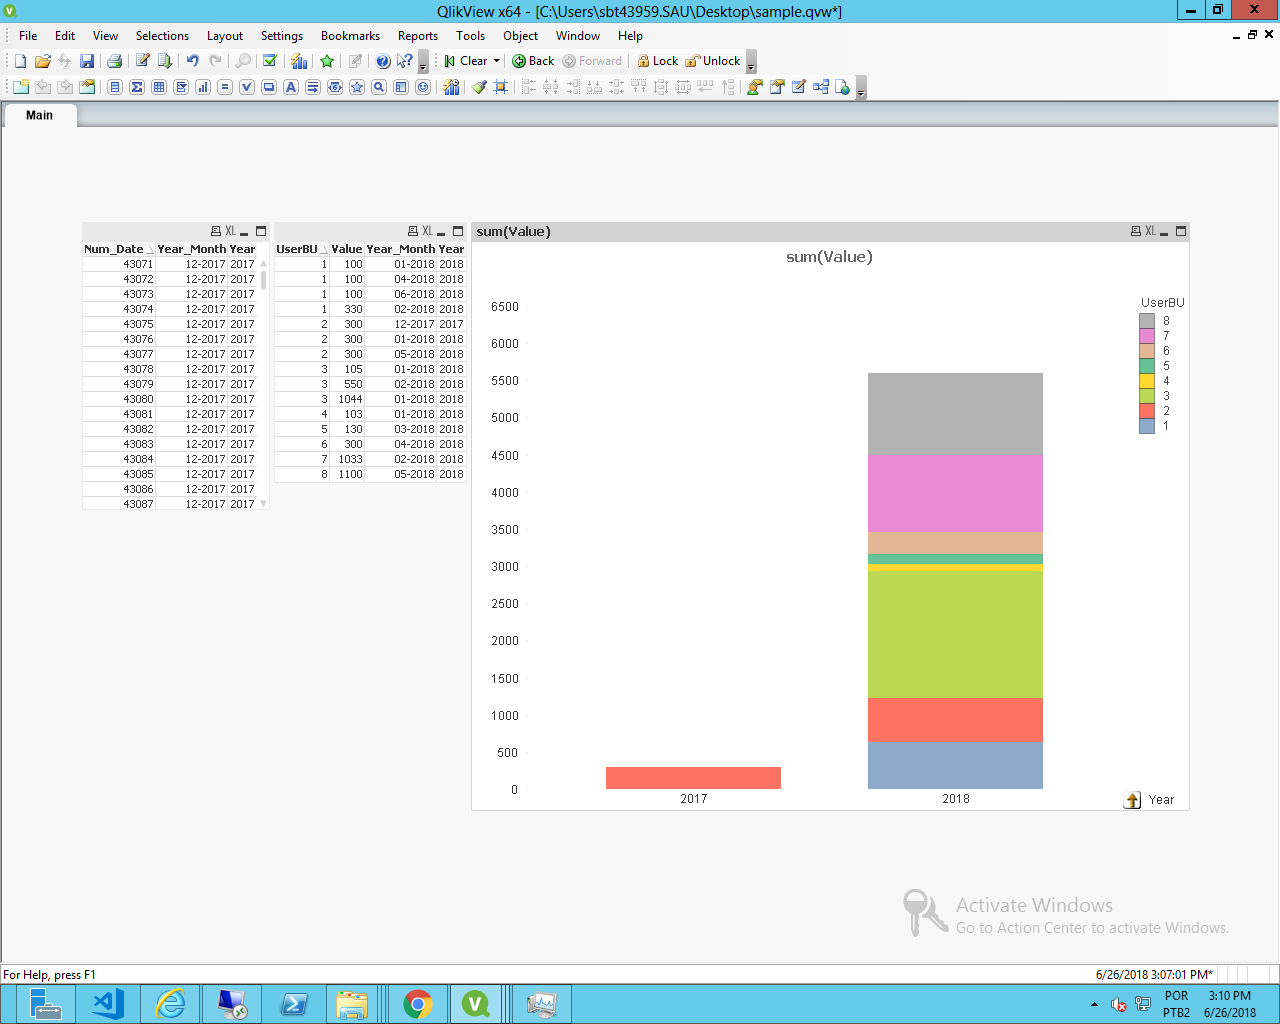
Next, i create the Year -> Year_Month drill-down dimension and apply it and the UserBU to the graph, giving me the following:
Without selections:
Selecting the Year:
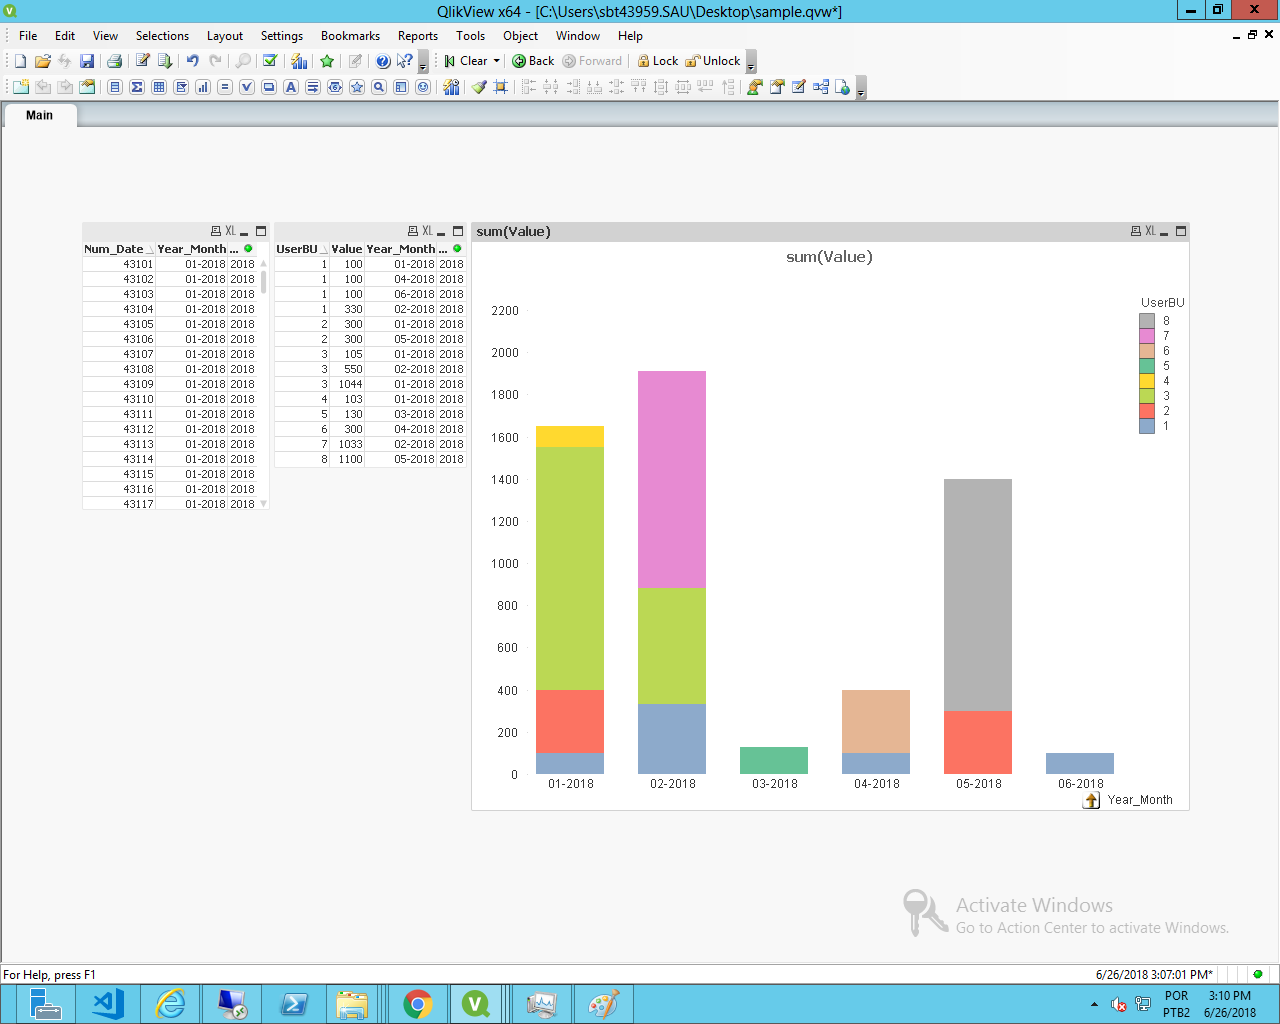
Is this what you have?
Attached the QVW if you can use it.
- Mark as New
- Bookmark
- Subscribe
- Mute
- Subscribe to RSS Feed
- Permalink
- Report Inappropriate Content
Thanks for your help Felip. I found the answer within the Master Calendar. Now i able to select the Year within a graph and it is applied as the Filter at the same time breaking down into months.