Unlock a world of possibilities! Login now and discover the exclusive benefits awaiting you.
- Qlik Community
- :
- Forums
- :
- Groups
- :
- Industry and Topics
- :
- Deployment Framework
- :
- BI QA AUTOMATION “QLIK BASED SOLUTION FOR REPORT Q...
- Subscribe to RSS Feed
- Mark Topic as New
- Mark Topic as Read
- Float this Topic for Current User
- Bookmark
- Subscribe
- Mute
- Printer Friendly Page
- Feature this Topic
- Mark as New
- Bookmark
- Subscribe
- Mute
- Subscribe to RSS Feed
- Permalink
- Report Inappropriate Content
BI QA AUTOMATION “QLIK BASED SOLUTION FOR REPORT QA AUTOMATION”
The next generation BI tools have changed the IT landscape of enterprises with features such as self-service reporting, ease of development and deployment, cloud and big data support. With these rich features and initiatives to modernize IT, there has been surge in adoption and migration to tools such as Qlik and Tableau. The enterprise tools are now focused on automation and reducing IT development and maintenance overheads. And QA, being an integral and critical part of development process, must have clear automation approach supported by tools. The white paper describes a BI QA Automation framework.
Enterprises use BI tools such as SAP BusinessObjects, SAP Crystal Reports, OBIEE, Qlik and Cognos for catering their reporting needs. One of the key factors for successful BI project implementation is the level of trust on the data depicted in reports and dashboards. Lack of trust in data causes attrition in user adoption and often results in project failure.
BI testing is the process of validating the data, format and performance of the reports, subject areas and security aspects of the governing project. Emphasis on a thorough BI Testing is key for improving the quality of the reports and user adoption. However, testing of the BI projects is different from traditional web application testing since the contents of the report is automatically generated by the BI tool based on the tool metadata. The focus of this article is to propose an automated approach to test the report data and its utilization would be a report migration project.
Need for Report QA Automation
Report Data Testing is an important process of assessing the reliability of information visualized on the report. It is required to sustain the trust of the user on the reports because reports are often used as key basis for management decisions and the user assumes that the information on the report is representative of source data.
A typical approach to verify report quality is to verify calculations on the reports themselves to the data in the source report or data warehouse. Thus the BI testing process becomes a manual one, which increases the workload for testers and making it prone to mistakes. Most BI tools manipulate/transform the source data, which makes it even harder to manually test. Manual testing also is a slow and cumbersome approach which compromises the accuracy of the testing.
It needs to be ensured that report data exactly matches with the expected output, as the reports act as a basis to make critical decisions. Having a manual QA process to validate reports has multiple downsides:
- Reports with large data cannot be accurately validated by manual process, and leaves room for potentially uncovered mismatches.
- Huge efforts required for manually validating the report data.
QA Automation Solution Design
As described in the Solution Architecture below the QA automation is done in following steps:
- 1. Qlik report extracts are generated by exporting the report contents
- 2. Based on the dimensions and measures identified by the automation utility, code Generator generates the Qlik script file to validate Qlik report data. The Qlik script test engine (an automated process to run the generated script) compared the Qlik data against Gold dump / Legacy BI report extracts and logs the differences in the test log on a database.
- 3. Gold dumps of expected report content are acquired from business user or by connecting to the legacy BI system which is to be migrated to Qlik.
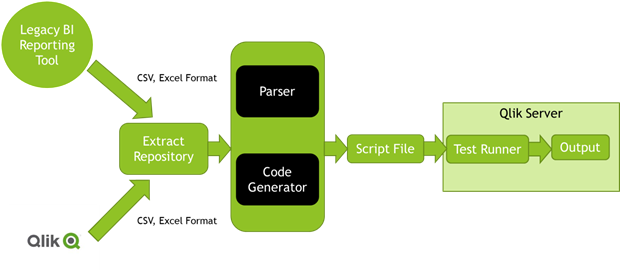
Fig 1: QA Automation Solution Architecture
- Legacy BI Report Data Extractor – Automated extract of data from Legacy BI Report data based on gold dump is pulled in Excel or CSV format and stored at the Extract Repository, as shown in the above figure.
- Qlik Data extractor – Automated extract of data from migrated Qlik report based on gold dump same as that of the Legacy BI Report is pulled in Excel or CSV format and stored at the Extract Repository.
- Qlik Code Generator – It is the module developed as an independent tool where user identifies the dimensions or primary fields by which the rows are identified uniquely and the measure fields whose data is to be compared. The Dimension and Measure fields are placed in a Database source system. Once the Dimensions and measures are known to the system, the Qlik Code generator engine initiates and generates the QlikView script to populate the Qlik report with data discrepancies and save it in a Qlik script file.
- Test Engine – Once the code is generated the user have option to run the Test Engine which will push the code to a Qlik interpretable QVS file on the Qlik Server and initiate the Qlik data comparison report load. On completion of the Qlik Load, the test result will be generated and displayed with option to export it into excel and preserve the result for future reference. The test result will provide the summary of the data discrepancies and the detailed view will highlight the missing data and data mismatches in red background.
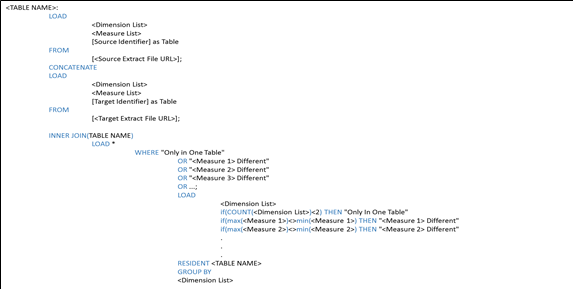
Generated Code Template
QA Automation Report
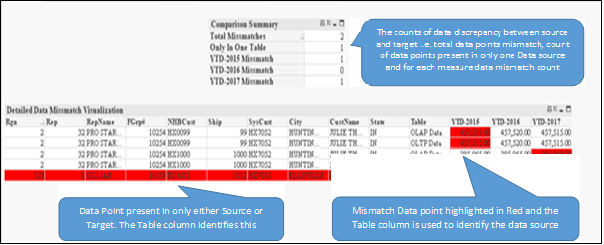
Fig 3: Report Output
The above figure is the snapshot of the test engine output where the “Comparison Summary” provides the count of Total mismatched data points and mismatch count by Measure. Also depicts count of data points which are present in either source or target.
The Detailed view highlights the mismatched data points in RED background. The column of interest here is “Table” from which one can identify to which source this data row belongs to i.e. in our case OLTP data means transaction data from SAP Crystal Reports and OLAP means Dimensional data from Qlik.
Benefit of ’s BI QA Automation Approach
As per the Analyst Firm Gartner- “The average organization loses $14.4 million dollars annually through poor data quality.”
- ’s automated approach saves a substantial amount of effort and time with enhanced accuracy
- To the organization which would adopt our approach will be benefited in terms of reduced project cost due to less number of testers and also reduced technical skills of the testers.
- A good automated BI report testing tool is also characterized by its user friendliness, which designed utility totally complements, so that even a non-technical user can also use it.
- Light weight and ease to configure are other features which makes the BI QA automation solution a desired utility by any user.
Conclusion
Automated BI report Data Quality Analysis approach is a full-proof automated solution to the challenges faced by the Quality Analysts while performing data matches in the environments like report migration from one BI tool to another. It has multiple file format support feature and based on the pre requisite that the data is freeze at same point for both the reporting tools. The observation is that it reduces the testing effort by around 80 percent with reduced number of resources and lesser technically skilled. So it ensures that the trust on the reports is enhanced by reducing the efforts.
- Mark as New
- Bookmark
- Subscribe
- Mute
- Subscribe to RSS Feed
- Permalink
- Report Inappropriate Content
10xs)
- Mark as New
- Bookmark
- Subscribe
- Mute
- Subscribe to RSS Feed
- Permalink
- Report Inappropriate Content
it will be great if a practical example is given to understand the automation process
- Mark as New
- Bookmark
- Subscribe
- Mute
- Subscribe to RSS Feed
- Permalink
- Report Inappropriate Content
Is it available to download?
- Mark as New
- Bookmark
- Subscribe
- Mute
- Subscribe to RSS Feed
- Permalink
- Report Inappropriate Content
1. Are all the templates mentioned in framework available to download please?
2. How to develop the automation utility that extracts data from source and also Qlik Sense dashboard?
3. Which Data base source system is used in Code Generator and is it free ware?
4. Any inputs please on how test engine has to be configured
- Mark as New
- Bookmark
- Subscribe
- Mute
- Subscribe to RSS Feed
- Permalink
- Report Inappropriate Content
How to automate data validation for SQL Server/Qlik project - seeking recommendations