Unlock a world of possibilities! Login now and discover the exclusive benefits awaiting you.
- Qlik Community
- :
- All Forums
- :
- Deployment & Management
- :
- Monitoring Apps 2.0 - Your Feedback on Operations ...
- Subscribe to RSS Feed
- Mark Topic as New
- Mark Topic as Read
- Float this Topic for Current User
- Bookmark
- Subscribe
- Mute
- Printer Friendly Page
- Mark as New
- Bookmark
- Subscribe
- Mute
- Subscribe to RSS Feed
- Permalink
- Report Inappropriate Content
Monitoring Apps 2.0 - Your Feedback on Operations & License Monitor apps
With Sense 2.0 out in the wild, I am highly interested in your feedback related to the Monitoring Apps - Operations Monitor & License Monitor.
- What do you find as the specific value points of the apps?
- Any favorite views or aspects of the apps?
- What did you hope to find but cannot?
- Anything unclear or confusing?
- How are you modifying the app? (Creating new charts or modifying existing? Adding data?)
- Are you looking at other apps instead to help you monitor/manage your deployment?
- Mark as New
- Bookmark
- Subscribe
- Mute
- Subscribe to RSS Feed
- Permalink
- Report Inappropriate Content
i like dashboard Summary. it's very interesting find all important value in one page.
Interestingly switching to more detailed options by clicking on these parameters.
What would like to see?
More advanced statistics on customers, for example the type of operating system, browser. Selection options in IP address.
also like what the analyst such that consumption login pass through so much they will end the days.
Login pass consumption at day, hours and minuters
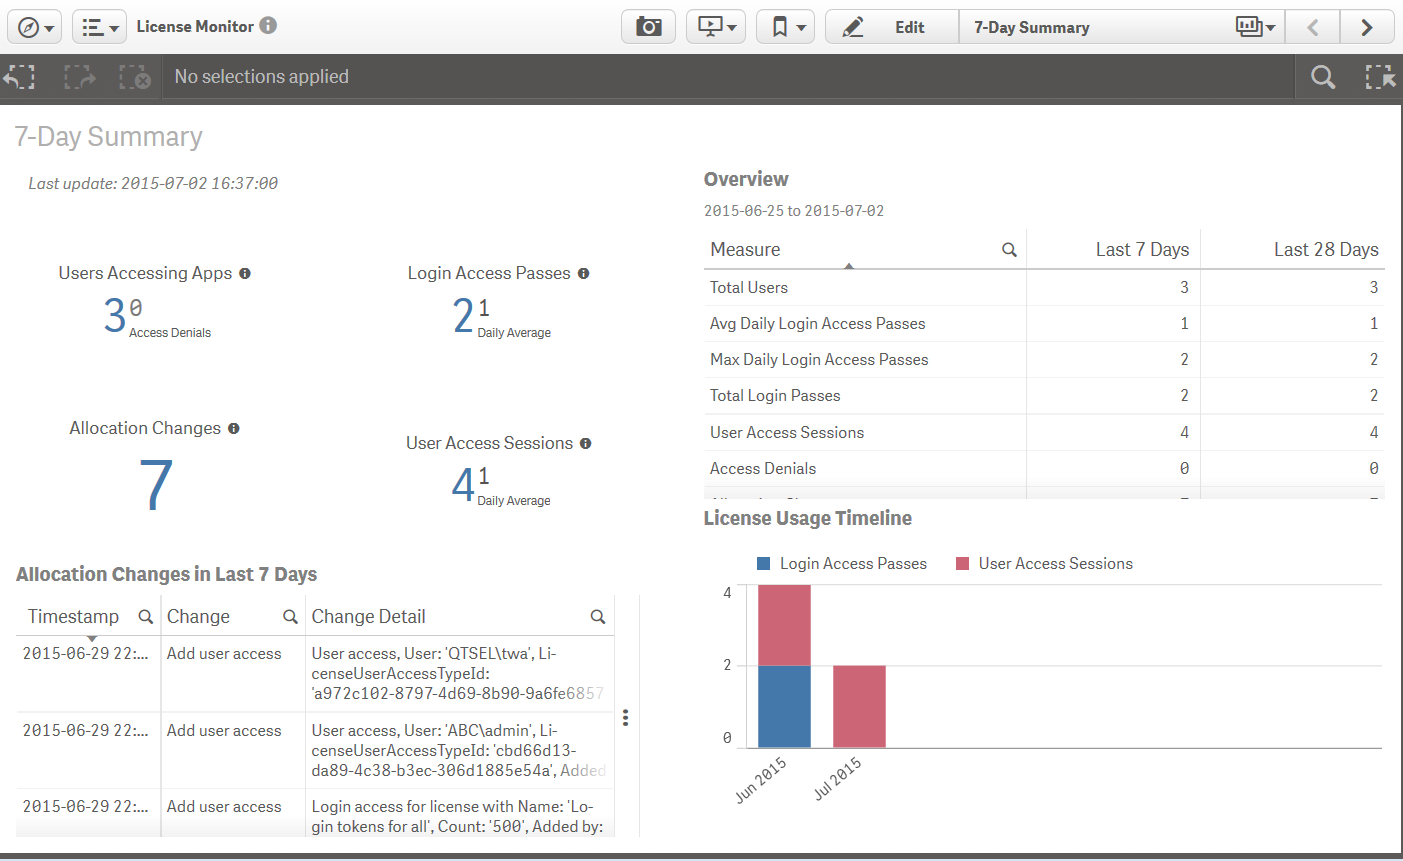
in License Monitor on sheet Login pass history has empty space in top right. Put here some intresting object
more graphics for greater visibility of data such as the number of concurent users, the number of open applications over time.
by tables full of eyes
I apologize for the poor knowledge of the English language
- Mark as New
- Bookmark
- Subscribe
- Mute
- Subscribe to RSS Feed
- Permalink
- Report Inappropriate Content
other comments. to find real answers to the problems of the server is very weak tool.
For example:
Operation monitor - Log Details
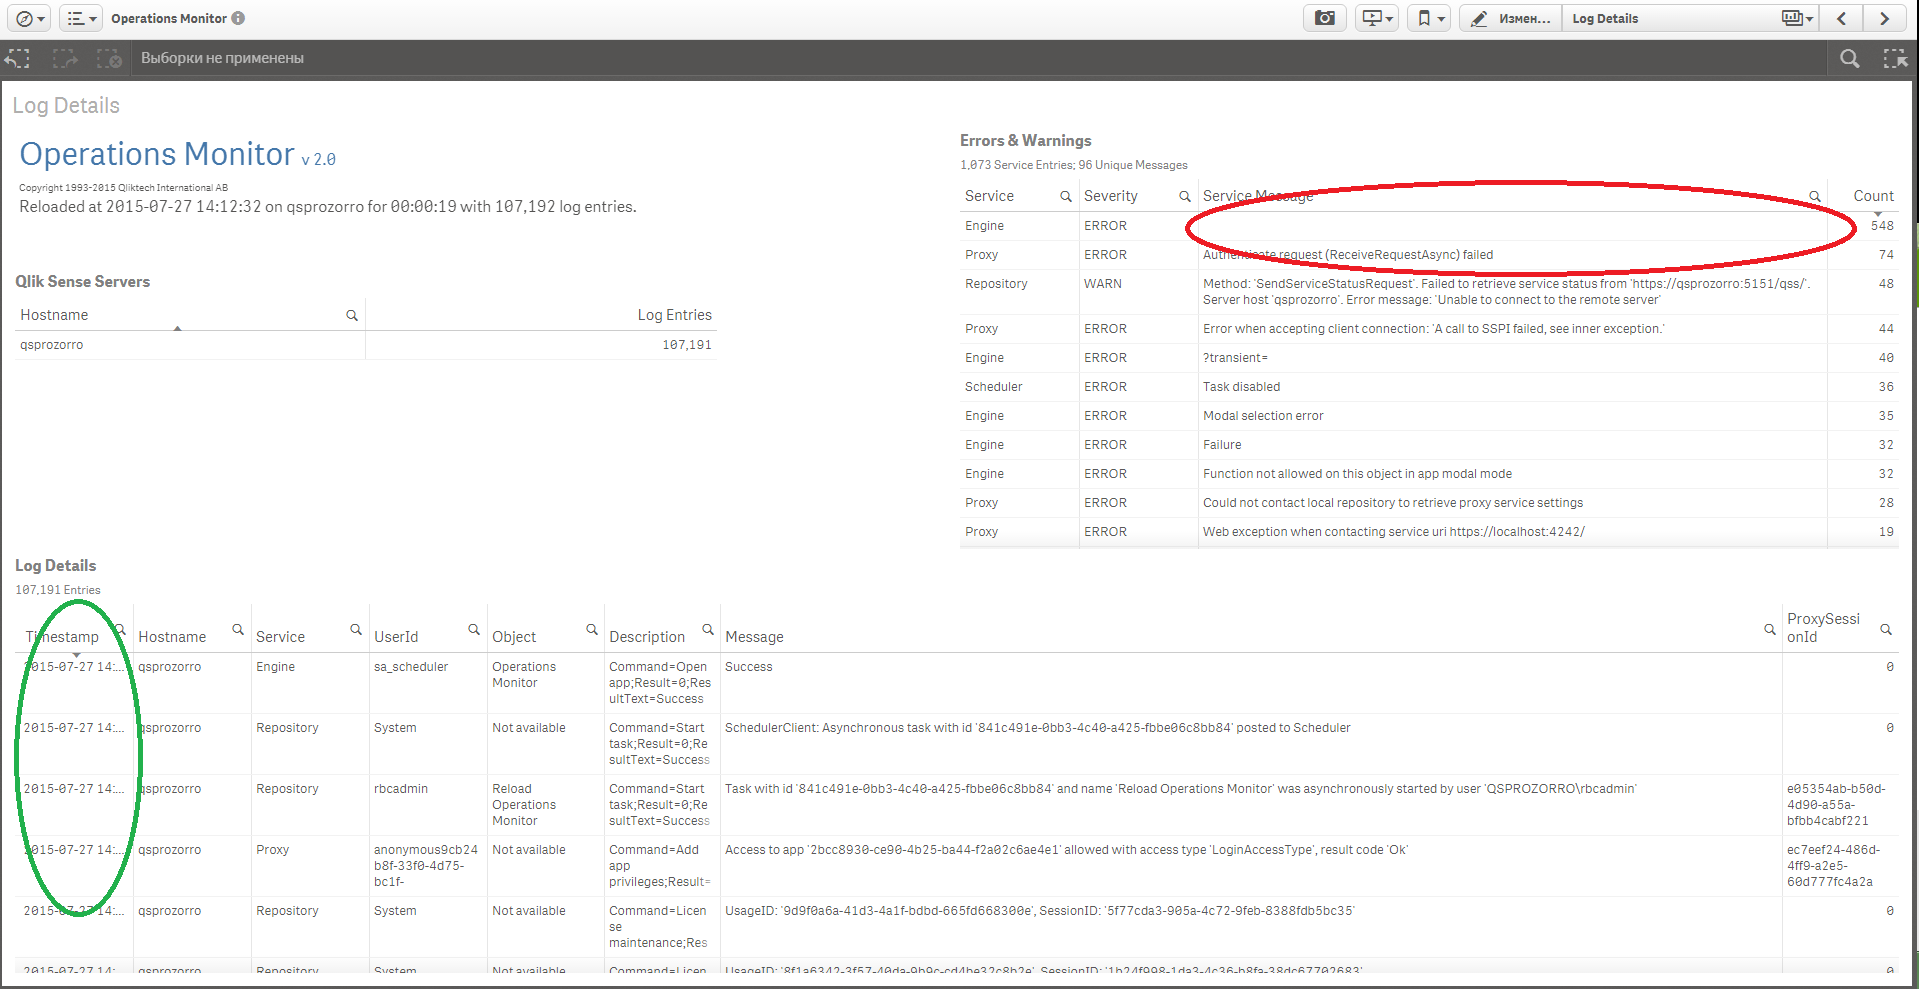
Red elipse - what is this error? Why an empty string? And I can not make a selection in the table that would look more detailed information in table Log Detail
Green Elipse - not a complete display of date. But it is just a huge void in the "message"
how I can fix it?
Problem with not complete display of date present in tables "Session Details" too
License Monitor - "License Allocation change History" and "License Log Details" - same problem
- Mark as New
- Bookmark
- Subscribe
- Mute
- Subscribe to RSS Feed
- Permalink
- Report Inappropriate Content
The blank error message you point out has been resolved and will be available in the next release of the Operations Monitor.
The truncated timestamp in the Log Details (green ellipse) is a property of the table objects in Sense and would have to be fixed at the product level. (I agree that the timestamp could be wrapped or something better than just cut off.)
- Mark as New
- Bookmark
- Subscribe
- Mute
- Subscribe to RSS Feed
- Permalink
- Report Inappropriate Content
Hi Tyler,
Is there a way to get the number of rows processed?
Our loads are taking longer to run (about 2 1/2 hours for the whole process).
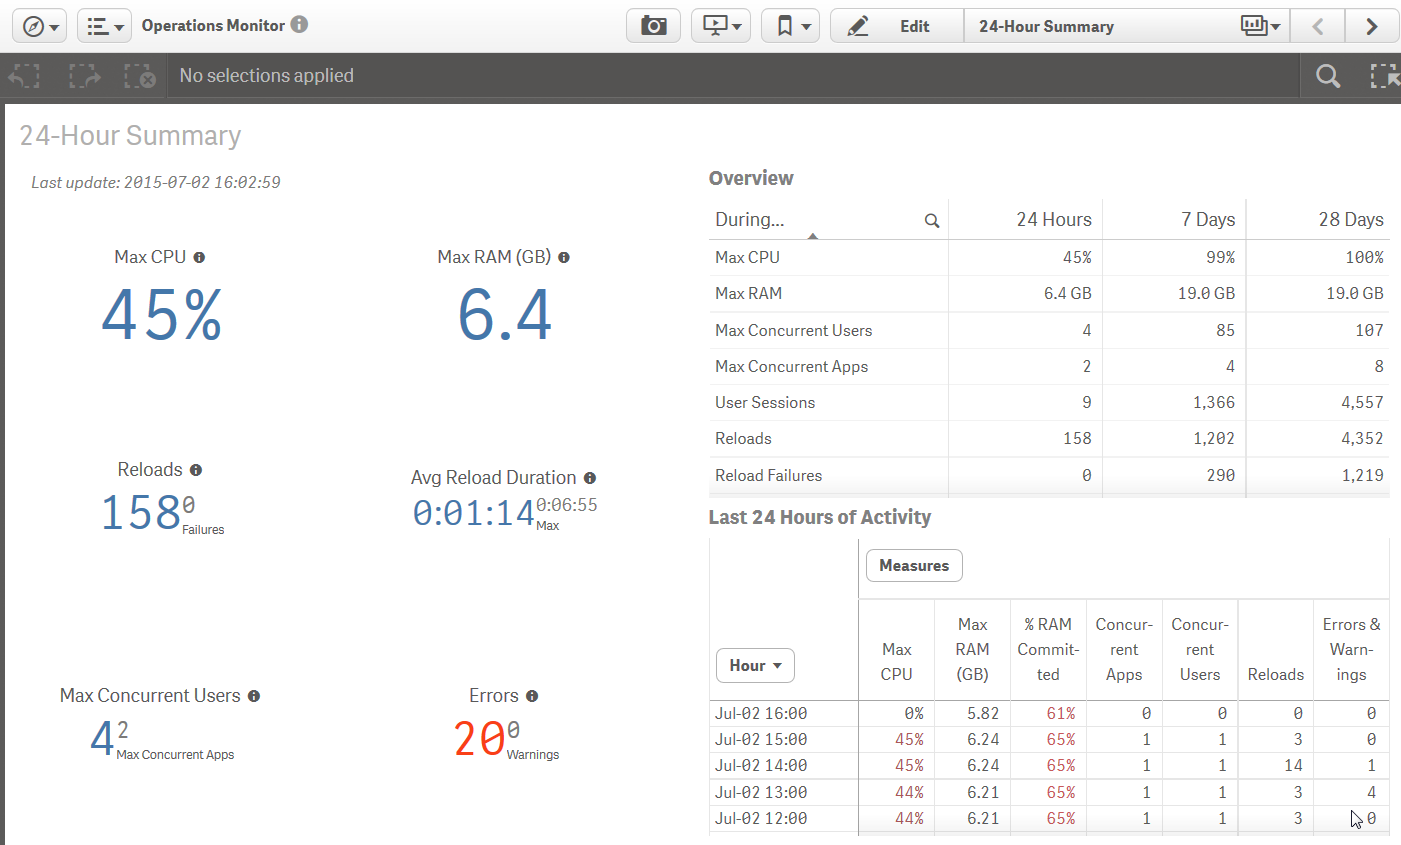
From the Performance sheet, on the performance Summary, there is Max CP and Max RAM. Both of these are very useful to determine if your system has enough RAM allocated to process.
However, in order to understand the full performance, I need to know what is occurring during some of the processing.
For the Extraction and Transformation streams, I would like to understand how many were processed from each of those steps. More granular, I would like to know how many rows were pulled from each table in the Extraction stream.
TIA,
Tom
- Mark as New
- Bookmark
- Subscribe
- Mute
- Subscribe to RSS Feed
- Permalink
- Report Inappropriate Content
Tom - you are referring to rows processed by the Qlik Engine - not the Monitoring apps - correct?
So, if you have 5 tasks reloading, you want to know how many rows each task is processing / or has processed?
(This is the task status you see in Desktop --- 1,000 lines fetched - for example.)
Am I understanding this correctly?
- Mark as New
- Bookmark
- Subscribe
- Mute
- Subscribe to RSS Feed
- Permalink
- Report Inappropriate Content
Hi Tyler,
Thanks for the quick response.
Yes, that is what I'm looking for.
Tom
- Mark as New
- Bookmark
- Subscribe
- Mute
- Subscribe to RSS Feed
- Permalink
- Report Inappropriate Content
Seems like a feasible request - this is the type of information you can see when you reload in Desktop.
I will submit this to our product request forum and see what kind of feedback and comments I get.
I personally would love to see this kind of detail as well!