Unlock a world of possibilities! Login now and discover the exclusive benefits awaiting you.
- Qlik Community
- :
- All Forums
- :
- Deployment & Management
- :
- Operations Monitor reload fail error Field 'entry_...
- Subscribe to RSS Feed
- Mark Topic as New
- Mark Topic as Read
- Float this Topic for Current User
- Bookmark
- Subscribe
- Mute
- Printer Friendly Page
- Mark as New
- Bookmark
- Subscribe
- Mute
- Subscribe to RSS Feed
- Permalink
- Report Inappropriate Content
Operations Monitor reload fail error Field 'entry_timestamp' not found
Qlik server "Operations Monitor" was reloading fine before.
The server CPU maxed out and after a restart the following error persists when trying to reload the "Operations Monitor".
SELECT * FROM "public"."view_system_errors_warnings"
WHERE entry_timestamp >= '2021-07-20 10:59:41'
Error: Field 'entry_timestamp' not found
Performing a test, reloading this view into an empty app and removing the where clause, present more details as to why this reload is failing from the PostGreSQL database.
SELECT entry_timestamp
,message
FROM "public"."view_system_errors_warnings"
1 fields found: *,
Error: ERROR [22P05] [Qlik][PostgreSQL] (30) Error occurred while trying to execute a query: [SQLState 22P05] ERROR: unsupported Unicode escape sequence
DETAIL: \u0000 cannot be converted to text.
CONTEXT: JSON data, line 1: ..."Failed to handle log pipe message","Exception":[...
This was copied from the Windows event viewer at application level:
The description for Event ID 0 from source PostgreSQL cannot be found. Either the component that raises this event is not installed on your local computer or the installation is corrupted. You can install or repair the component on the local computer.
If the event originated on another computer, the display information had to be saved with the event.
The following information was included with the event:
ERROR: unsupported Unicode escape sequence
DETAIL: \u0000 cannot be converted to text.
CONTEXT: JSON data, line 1: ..."Failed to handle log pipe message","Exception":[...
STATEMENT: fetch 200 in "SQL_CUR6";
Question is how do we resolve this?
The view seem to have either been corrupted or it contains the unsupported Unicode escape sequence.
The windows event viewer reported under system earlier;
The following service has repeatedly stopped responding to service control requests: Qlik Sense Engine Service
Contact the service vendor or the system administrator about whether to disable this service until the problem is identified.
You may have to restart the computer in safe mode before you can disable the service.
Any suggestions on what the next steps are to resolve this would be appreciated.
Accepted Solutions
- Mark as New
- Bookmark
- Subscribe
- Mute
- Subscribe to RSS Feed
- Permalink
- Report Inappropriate Content
Hi @isozander
If I am understanding the issue correctly with the errors posted, you must be having Centralized logging and for some reasons after your restart the connection to Q logs is not happening.
If yes, try below
1) Make a copy of the operations monitor app
2) Go to data load editor
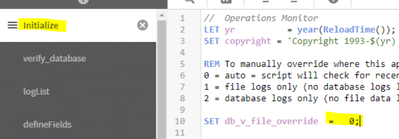
3) In the Initialize section, change the SET db_v_file_override = 0; to SET db_v_file_override = 1;
4) Ensure your connection string on data connections ArchivedLogsFolder and ServerLogFolder is pointing to correct path
5) Load data
If this works continue with log files only since Centralized Logging service is being deprecated from May 2021
Hope this helps. Good Luck
- Mark as New
- Bookmark
- Subscribe
- Mute
- Subscribe to RSS Feed
- Permalink
- Report Inappropriate Content
Thank you for the guidance and solution to the issue experienced Vikram.
- Mark as New
- Bookmark
- Subscribe
- Mute
- Subscribe to RSS Feed
- Permalink
- Report Inappropriate Content
Hi,
I have the same issue. The operations monitor has been running fine for few months and all of a sudden it fails as below.
20210922T105819.463-0700 0595 SELECT * FROM "public"."view_system_errors_warnings"
20210922T105819.463-0700 0596 WHERE entry_timestamp >= '2019-09-05 00:00:00'
20210922T105819.562-0700 Error: Field 'entry_timestamp' not found
20210922T105820.081-0700 Execution Failed
20210922T105820.101-0700 Execution finished.
When I run only the select * FROM "public"."view_system_errors_warnings" from Qlogs WHERE entry_timestamp >= '2019-09-05 00:00:00' there is no error.
I imported operations monitor qvf again but the same issue still persists.
I don't want to change the SET db_v_file_override = 0; to SET db_v_file_override = 1;
What might be an solution to this?
Thanks
- Mark as New
- Bookmark
- Subscribe
- Mute
- Subscribe to RSS Feed
- Permalink
- Report Inappropriate Content
Hi,
it is not working with file logging options, it gives some other error now
