Unlock a world of possibilities! Login now and discover the exclusive benefits awaiting you.
- Qlik Community
- :
- All Forums
- :
- Deployment & Management
- :
- Performance - System Engine Logs
- Subscribe to RSS Feed
- Mark Topic as New
- Mark Topic as Read
- Float this Topic for Current User
- Bookmark
- Subscribe
- Mute
- Printer Friendly Page
- Mark as New
- Bookmark
- Subscribe
- Mute
- Subscribe to RSS Feed
- Permalink
- Report Inappropriate Content
Performance - System Engine Logs
Hi,
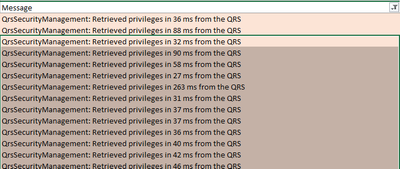
As per the recommendation - network and persistence the network latency should be less than 4ms but in the system engine logs the message it is giving during peak hours is for example - "QrsSecurityManagement: Retrieved privileges in 384 ms from the QRS". Please refer screenshot.
During this time users are using the application and reloading for the same application is also in progress.
We are using a Multi node setup and reload is happening on the RIM node. QRS DB is on the central node.
Does this message mean the network is too slow, so the system is performing very slow resulting in delayed reload or delayed dashboards loading? / How do we interpret this message in terms of performance?
- Tags:
- network
- performance
Accepted Solutions
- Mark as New
- Bookmark
- Subscribe
- Mute
- Subscribe to RSS Feed
- Permalink
- Report Inappropriate Content
Hello @sudhakar_c
This message means that it took an x amount of milliseconds to retrieve validations of current security rules request from the Engine towards the Repository Database via the Repository Service.
It does not say that the network is slow. The latency 4ms would be measurable with e.g. ping.
It means that the query in the back took a while to be processed and returned.
If you have many custom security rules that could take longer. Check the performance of your central node during peaks that is on place where the bottleneck would show first. (E.g. cpu on more than 90% for more than 5 min)
Best Regards
Sebastian
