Unlock a world of possibilities! Login now and discover the exclusive benefits awaiting you.
Announcements
Qlik Connect 2025: 3 days of full immersion in data, analytics, and AI. May 13-15 | Orlando, FL:
Learn More
- Qlik Community
- :
- All Forums
- :
- Deployment & Management
- :
- display all date in graph in curve
Options
- Subscribe to RSS Feed
- Mark Topic as New
- Mark Topic as Read
- Float this Topic for Current User
- Bookmark
- Subscribe
- Mute
- Printer Friendly Page
Turn on suggestions
Auto-suggest helps you quickly narrow down your search results by suggesting possible matches as you type.
Showing results for
Specialist
2018-01-03
04:02 AM
- Mark as New
- Bookmark
- Subscribe
- Mute
- Subscribe to RSS Feed
- Permalink
- Report Inappropriate Content
display all date in graph in curve
Hello,
I have graph in curve and i want to display all dates :
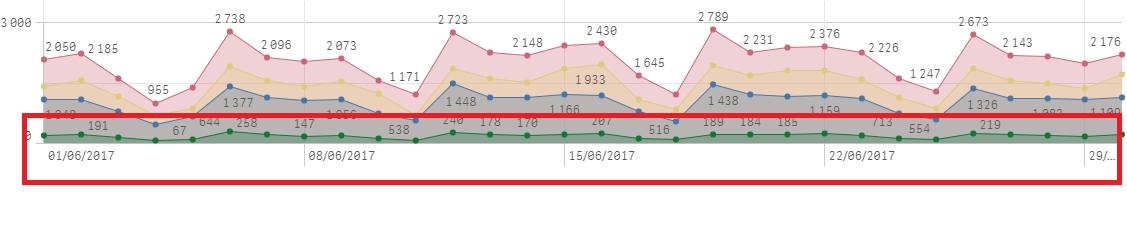
I want to display 02/06/2017.....
Thanks
259 Views
1 Solution
Accepted Solutions
Specialist III
2018-01-03
04:35 AM
- Mark as New
- Bookmark
- Subscribe
- Mute
- Subscribe to RSS Feed
- Permalink
- Report Inappropriate Content
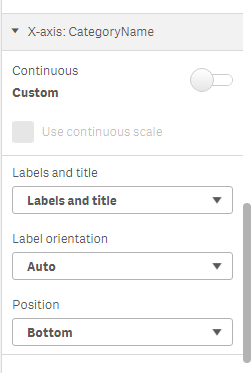
Hi Zied,
Can you try to disable the option which is available in Properties under X-Axis
1 Reply
Specialist III
2018-01-03
04:35 AM
- Mark as New
- Bookmark
- Subscribe
- Mute
- Subscribe to RSS Feed
- Permalink
- Report Inappropriate Content
Hi Zied,
Can you try to disable the option which is available in Properties under X-Axis