Unlock a world of possibilities! Login now and discover the exclusive benefits awaiting you.
- Qlik Community
- :
- Blogs
- :
- Technical
- :
- Design
- :
- Average – Which average?
- Subscribe to RSS Feed
- Mark as New
- Mark as Read
- Bookmark
- Subscribe
- Printer Friendly Page
- Report Inappropriate Content
If you want to display an average number of something in QlikView, you should use the Avg() function, right?
Wrong.
Yes, there is an Avg() function that returns the average value, but – this is usually not the value that you are looking for. The Avg() function returns the average transactional value, whereas you probably are looking for a larger amount.
For example, let’s say that you have an orders database where the grain - the most atomic level – of the data is Order Line. Each order can have several order lines and each order line has an amount. Then, the Avg() function will return the average order line amount, which is utterly uninteresting. No, you are most likely more interested in questions like “How much do we sell per month, on the average?”
In other words – a calculation of an average has an implicit internal grouping entity; the average per month, per day, per order, per delivery or something else. You can look at it as a two-step aggregation:
- Sum all the amounts – per each value of the internal grouping entity (e.g. month, day, order or delivery)
- Calculate the average of the sums from previous bullet.
In QlikView, you would calculate the average monthly sales value in one of the two following ways:
Sum( Amount ) / Count( distinct MonthID )
Avg( Aggr( Sum(Amount), MonthID ) )
… and similarly for orders, days or deliveries. Use of the Aggr() function will work, but it is not as fast as the first option, and should therefore be avoided.
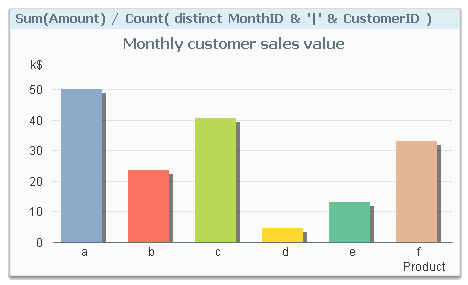
Sometimes there are several internal grouping entities. You may for instance want to show the average monthly sales value per customer, i.e. you want to use both month and customer as grouping entity. Then you should use one of the following expressions:
Sum( Amount ) / Count( distinct MonthID & '|' & CustomerID )
Avg( Aggr( Sum(Amount), MonthID, CustomerID ) )
The Count() aggregation with a string concatenation will find every unique combination of month and customer.
Note that the internal grouping entity has nothing to do with the dimension you choose to use when you display it. It would make perfect sense to show the above number using Product as the only dimension, as shown in the graph below. Hence, the internal grouping entity is not necessarily visible in the end result.
So, you need to figure out which internal grouping entity you want and then use this in a smart way in your expression.
And by the way – an internal grouping entity can be used also for other aggregation functions: Smallest, largest, most common: Min(), Max(), Mode(). But for these, you will need to use the Aggr() function.
- « Previous
-
- 1
- 2
- 3
- 4
- Next »
You must be a registered user to add a comment. If you've already registered, sign in. Otherwise, register and sign in.