Unlock a world of possibilities! Login now and discover the exclusive benefits awaiting you.
- Qlik Community
- :
- Blogs
- :
- Technical
- :
- Design
- :
- Coloring a Scatter Plot
- Subscribe to RSS Feed
- Mark as New
- Mark as Read
- Bookmark
- Subscribe
- Printer Friendly Page
- Report Inappropriate Content
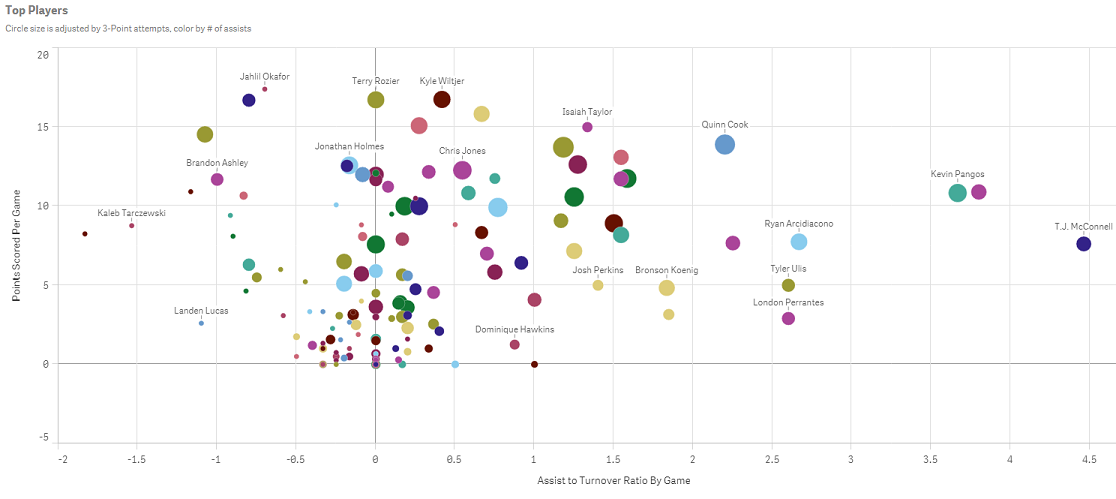
It is known as the Skittles effect. It happens when a developer creates a scatter plot and decides to color the plotted values by the dimension. This practice not only does nothing to tell the data story, it actually distracts the user from understanding what the data is actually saying. Have no fear; there are a couple of solutions to this problem. In this blog, I will discuss one: coloring the dimension by an expression.
Using an expression to color your plotted values
Both QlikView and Qlik Sense allow users to color the plotted values using an expression. In Qlik View, this is achieved by going to the expressions tab. Under the expression simply select Background color and enter the color expression.
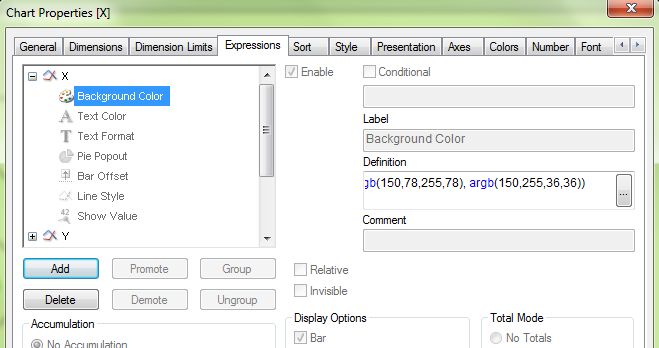
This expression is telling QlikView to color all plotted values greater than zero as green, else color them red.
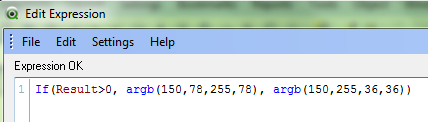
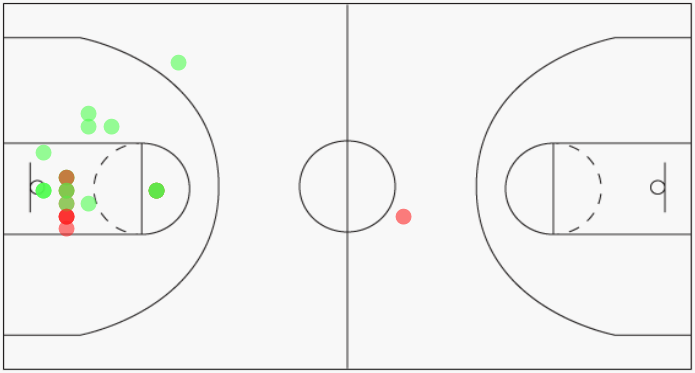
By coloring the plotted values using green and red, I can now identify which shots were made vs missed.
In Qlik Sense, this is accomplished by navigating to the properties panel on the right and selecting Colors and Legends. Switch the radio button off of the default setting of single color. Then select By expression, enter the color expression and make sure to check the box for This expression is a color code.
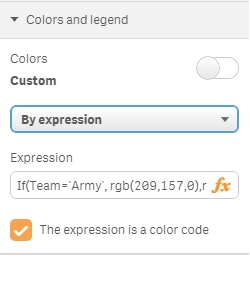
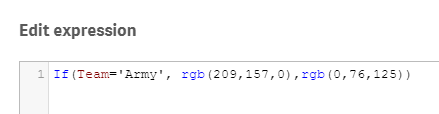
The expression defined here tells Qlik Sense to color all players from Army as gold, else color the players as blue.
Here is how Qlik Sense will render the chart once the color expression has been defined. I can easily identify the players from Army versus the players from Duke.
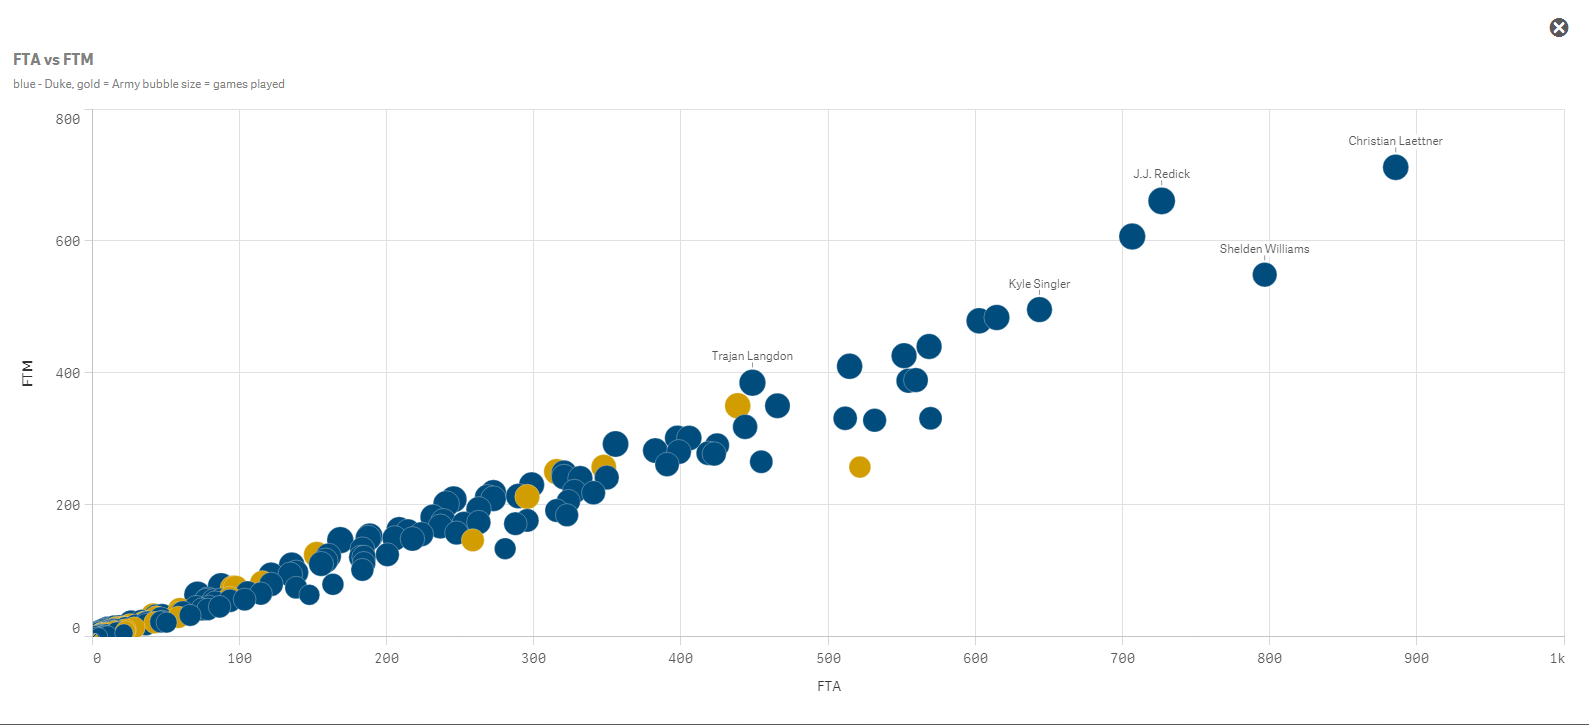
One word of caution, coloring by expression is best suited for small groups of colors. I would say 3-4 colors maximum. Otherwise you start to create your own controlled Skittles effect. It is also best practice to let the user know what the colors represent. Here I utilized Qlik Sense’s subtitle field to define the colors for the users.
Happy Qliking!
You must be a registered user to add a comment. If you've already registered, sign in. Otherwise, register and sign in.