Unlock a world of possibilities! Login now and discover the exclusive benefits awaiting you.
- Qlik Community
- :
- Blogs
- :
- Technical
- :
- Design
- :
- IntervalMatch
- Subscribe to RSS Feed
- Mark as New
- Mark as Read
- Bookmark
- Subscribe
- Printer Friendly Page
- Report Inappropriate Content
A common problem in business intelligence is when you want to link a number to a range. It could be that you have a date in one table and an interval – a “From” date and a “To” date – in another table, and you want to link the two tables. In SQL, you would probably join them using a BETWEEN clause in the comparison.
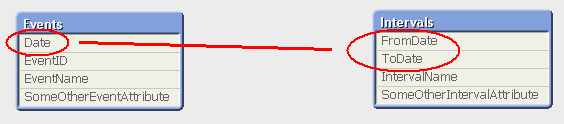
But how do you solve this in QlikView, where you should avoid joins?
The answer is to use IntervalMatch.
IntervalMatch is a prefix that can be put in front of either a Load or a SELECT statement. The Load/SELECT statement needs to contain two fields only: the “From” and the “To” fields defining the intervals. The IntervalMatch will generate all the combinations between the loaded intervals and a previously loaded numeric field.
Typically, you would first load the table with the individual numbers (The Events), then the table with the Intervals, and finally an intervalmatch that creates a third table that bridges the two first tables.
Events:
Load * From Events;
Intervals:
Load * From Intervals;
IntervalMatch:
IntervalMatch (Date)
Load distinct FromDate, ToDate resident Intervals;
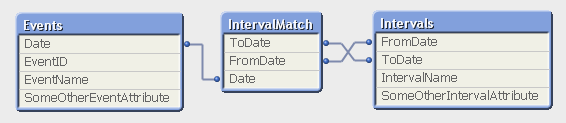
The resulting data model contains three tables:
- The Events table that contains exactly one record per event.
- The Intervals table that contains exactly one record per interval.
- The IntervalMatch table that contains exactly one record per combination of event and interval, and that links the two previous tables.
Note that this means that an event may belong to several intervals, if the intervals are overlapping. And an interval can of course have several events belonging to it.
This data model is optimal, in the sense that it is normalized and compact. All QlikView calculations operating on these tables e.g. Count(EventID) will work and will be evaluated correctly. This means that it is not necessary to join the intervalmatch table onto one of the original tables. Joining it onto another table may even cause QlikView to calculate aggregations incorrectly, since the join can change the number of records in a table.
Further, the data model contains a composite key (the FromDate and ToDate fields) which will manifest itself as a QlikView synthetic key. But have no fear. This synthetic key should be there; not only is it correct, but it is also optimal given the data model. You do not need to remove it.
IntervalMatch can also be used with an additional key between the tables – i.e. when you have Slowly Changing Dimensions. But more about that in a later post.
For more on IntervalMatch and some script examples, see the technical brief IntervalMatch and Slowly Changing Dimensions.
You must be a registered user to add a comment. If you've already registered, sign in. Otherwise, register and sign in.