Unlock a world of possibilities! Login now and discover the exclusive benefits awaiting you.


.png "Former Employee") hic
hic
- Subscribe to RSS Feed
- Mark as New
- Mark as Read
- Bookmark
- Subscribe
- Printer Friendly Page
- Report Inappropriate Content
Set Analysis is really a simple and straightforward tool, but with an advanced syntax. “Simple” since its only function is to allow you to define a calculation scope different from the current selection. The basics are very much like defining a SQL Where clause.
A different term for the scope is the “record set”. With this, we mean the set of records in the data over which the aggregations should be calculated.

The above Set analysis expression is equivalent to selecting 2015 from OrderYear. It is also equivalent to a SQL condition “Where OrderYear=2015”.
The Set analysis syntax is advanced because there are so many different ways to define a record set; you can use a selection, a bookmark, or an alternate state. Further, just as in any set algebra, you can define intersections, unions and other set operations, e.g. the difference between two sets:

This expression describes the Set difference between current selection in the default state $ and selection in the alternate state State2: I.e. records that are included by the default state, but not included in State2.
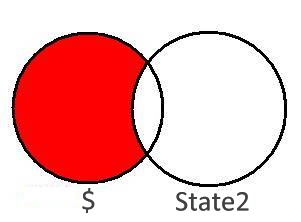
Another set expression is the following:

This defines the records belonging to any order date that occurs before the latest order date in the current selection. The dollar expansion is needed, since the parser expects field values in clear text in the search string.
Note that the last Set expression contains two pairs of curly brackets. Set analysis expressions with many curly brackets look complicated, but there is in fact method in the madness…
- The outer brackets: Sum( { … } Sales )
These define the record set; i.e. the records in the data over which the aggregation should be made. - The inner brackets: Sum( {$<Field= { … } >} Sales )
These define the element set; i.e. the set of individual field values that define the selection in this field.
For those of you who have read about Symbol Tables and Bit-Stuffed Pointers it may be interesting to know that the element set operate on the symbol tables, whereas the record set is defined on the data tables.
The element set can be a list of values or a search string. It can also be described by field references or by the P() and E() functions, e.g.

Summary:
- There are two different sets in a Set expression: The Record Set and the Element Set.
- The record set (the outer curly brackets) defines the records in the data tables. Use 1, $, a bookmark or an alternate state as Set identifier.
- The element set (the inner curly brackets) defines the selection that modifies a record set. Use one or several of the following to define your element set:
- A list of values, e.g: {2013,2014,2015}
- A search, e.g: {">=2015-01-06<=2015-02-05"}
- A field reference
- A set function, i.e: P() or E()
- Set operators can be used to define both the record set and the element set.
With this, I hope that you understand Set Analysis somewhat better.
Further reading related to this topic:
You must be a registered user to add a comment. If you've already registered, sign in. Otherwise, register and sign in.