Unlock a world of possibilities! Login now and discover the exclusive benefits awaiting you.
- Qlik Community
- :
- Forums
- :
- Groups
- :
- Location and Language
- :
- Francophones
- :
- Customer projection/trend
- Subscribe to RSS Feed
- Mark Topic as New
- Mark Topic as Read
- Float this Topic for Current User
- Bookmark
- Subscribe
- Mute
- Printer Friendly Page
- Feature this Topic
- Mark as New
- Bookmark
- Subscribe
- Mute
- Subscribe to RSS Feed
- Permalink
- Report Inappropriate Content
Customer projection/trend
Hello everyone,
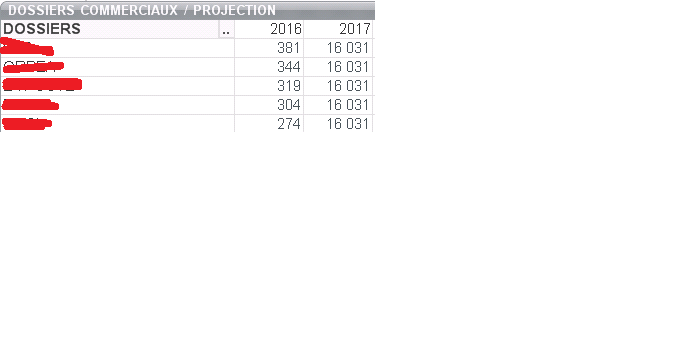
I have in a pivot table :
- my full time in 2016
- my full time in 2017 (until today)
How it's possible to add a projection for 2017 ?
Thanks for your help.
Emmanuelle
- Mark as New
- Bookmark
- Subscribe
- Mute
- Subscribe to RSS Feed
- Permalink
- Report Inappropriate Content
- Mark as New
- Bookmark
- Subscribe
- Mute
- Subscribe to RSS Feed
- Permalink
- Report Inappropriate Content
Check same thing for your Data
LOAD * Inline [
Year,Value
2010,100
2011,200
2012,250
2013,150
2014,200
2015,120
2016, 140
2017, ];
Dim -- Year
Expression:
if(Year<>'2017',sum(Value),
linest_m(total aggr(if(sum(Value),sum(Value)),Year),Year)*Year
+linest_b(total aggr(if(sum(Value),sum(Value)),Year),Year))
- Mark as New
- Bookmark
- Subscribe
- Mute
- Subscribe to RSS Feed
- Permalink
- Report Inappropriate Content
I have a global number who seems correct.
It's possible to have projection for each one of my clients ?
- Mark as New
- Bookmark
- Subscribe
- Mute
- Subscribe to RSS Feed
- Permalink
- Report Inappropriate Content
Yes, It is.
- Mark as New
- Bookmark
- Subscribe
- Mute
- Subscribe to RSS Feed
- Permalink
- Report Inappropriate Content
It does not work.
My pivot table brings back only one value and not a projection for each client.
- Mark as New
- Bookmark
- Subscribe
- Mute
- Subscribe to RSS Feed
- Permalink
- Report Inappropriate Content
Hi Emmanuelle,
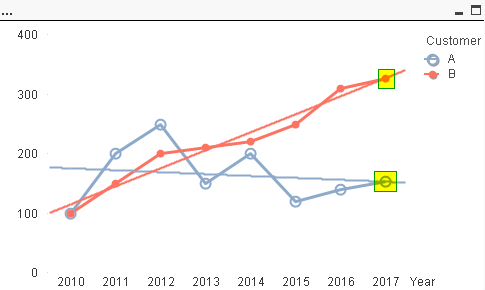
An example with two customers A and B :
LOAD * INLINE [
Year, Value, Customer
2010, 100, A
2011, 200, A
2012, 250, A
2013, 150, A
2014, 200, A
2015, 120, A
2016, 140, A
2017, , A
2010, 100, B
2011, 150, B
2012, 200, B
2013, 210, B
2014, 220, B
2015, 250, B
2016, 310, B
2017, , B
];
Dimensions : Year, Customer
Expression :
if(Year<>'2017',sum(Value),
linest_m(TOTAL <Customer> aggr(if(sum(Value),sum(Value)),Year, Customer),Year)*Year
+linest_b(TOTAL <Customer> aggr(if(sum(Value),sum(Value)),Year, Customer),Year)
)
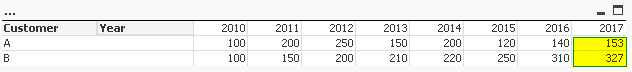
If we add the linar approximation on the graph, we could see that the calculated point is just on it