Unlock a world of possibilities! Login now and discover the exclusive benefits awaiting you.
- Qlik Community
- :
- All Forums
- :
- GeoAnalytics
- :
- Re: Aggregating network edges on a global map
- Subscribe to RSS Feed
- Mark Topic as New
- Mark Topic as Read
- Float this Topic for Current User
- Bookmark
- Subscribe
- Mute
- Printer Friendly Page
- Mark as New
- Bookmark
- Subscribe
- Mute
- Subscribe to RSS Feed
- Permalink
- Report Inappropriate Content
Aggregating network edges on a global map
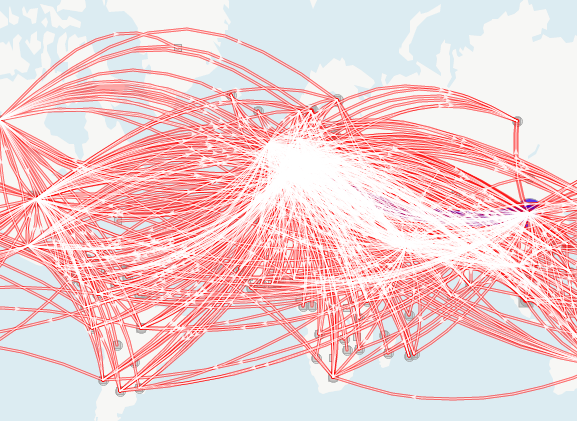
I currently have a huge dataset of movements across the world from point A to B, country to country. So I would need to visualize my data exactly to how it looks like below:
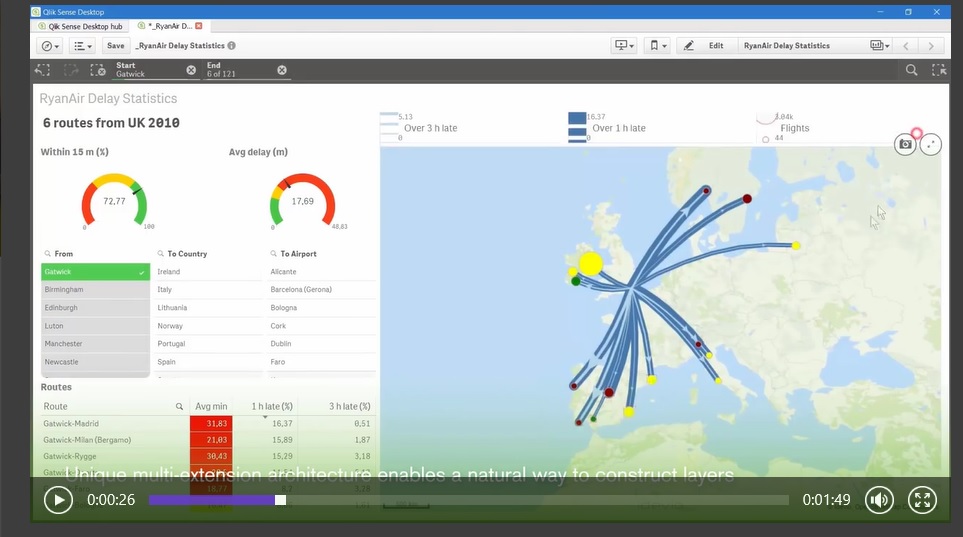
However, i would need to keep my data at a "shipment" level. So that I can filter by month, year, carrier, or any other data cut.
The line thickness will need to be aggregated in browser, according to the filters set by the user. Does QlikSense support this?
And how is the performance like? How many edges can I really display at one go in QlikSense?
This is also similar to the questions posted here:
https://stackoverflow.com/questions/36681390/gephi-aggregating-edges
https://stackoverflow.com/questions/33307942/edges-with-same-source-and-target-in-gephi
Accepted Solutions
- Mark as New
- Bookmark
- Subscribe
- Mute
- Subscribe to RSS Feed
- Permalink
- Report Inappropriate Content
Hi Michael,
Sure, that can be done in Qlik Sense with QlikGeoAnalytics, you can aggregate on country to country routes while still showing KPIs based on shipments. Filter by month, year, carrier, or any other data cut is standard in Sense. Line thickness can be set with based on your expressions and KPIs. 15,000-20,000 lines is no problem at all.
Thanks,
Patric Nordström
Qlik