Unlock a world of possibilities! Login now and discover the exclusive benefits awaiting you.
- Qlik Community
- :
- All Forums
- :
- GeoAnalytics
- :
- Different colors: ORIG->DEST and DEST->ORIG
- Subscribe to RSS Feed
- Mark Topic as New
- Mark Topic as Read
- Float this Topic for Current User
- Bookmark
- Subscribe
- Mute
- Printer Friendly Page
- Mark as New
- Bookmark
- Subscribe
- Mute
- Subscribe to RSS Feed
- Permalink
- Report Inappropriate Content
Different colors: ORIG->DEST and DEST->ORIG
Hello guys,
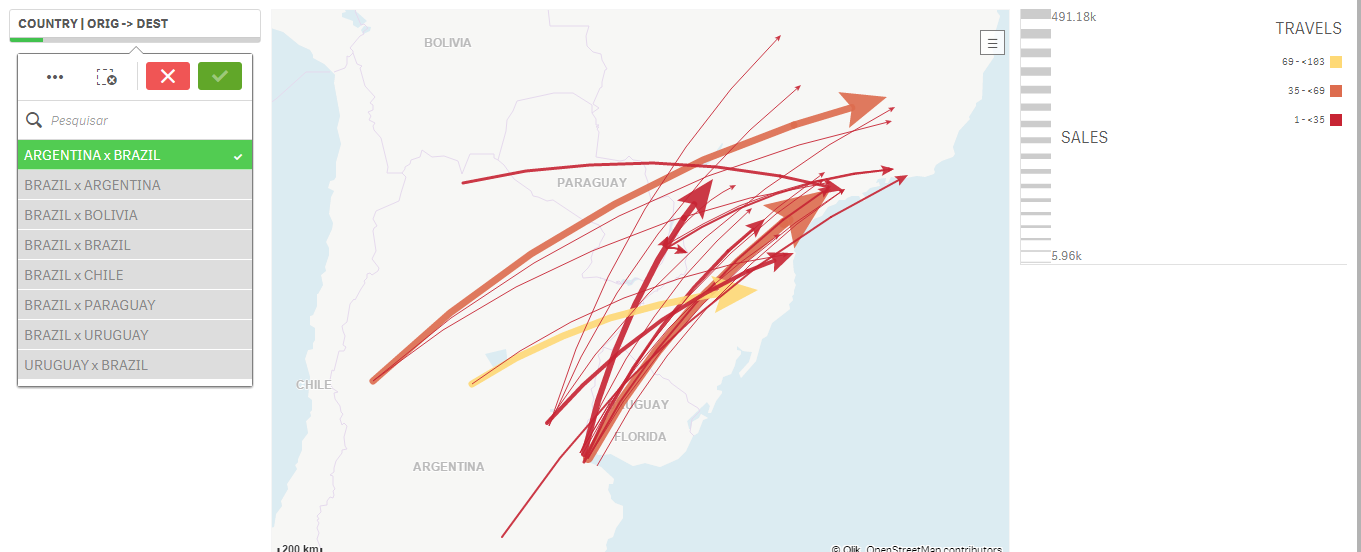
I have an application using GEOANALYTICS LINE LAYER type, where I have routes of ORIG and DEST (SCREEN 01: ARGENTINA -> BRAZIL) in red color.
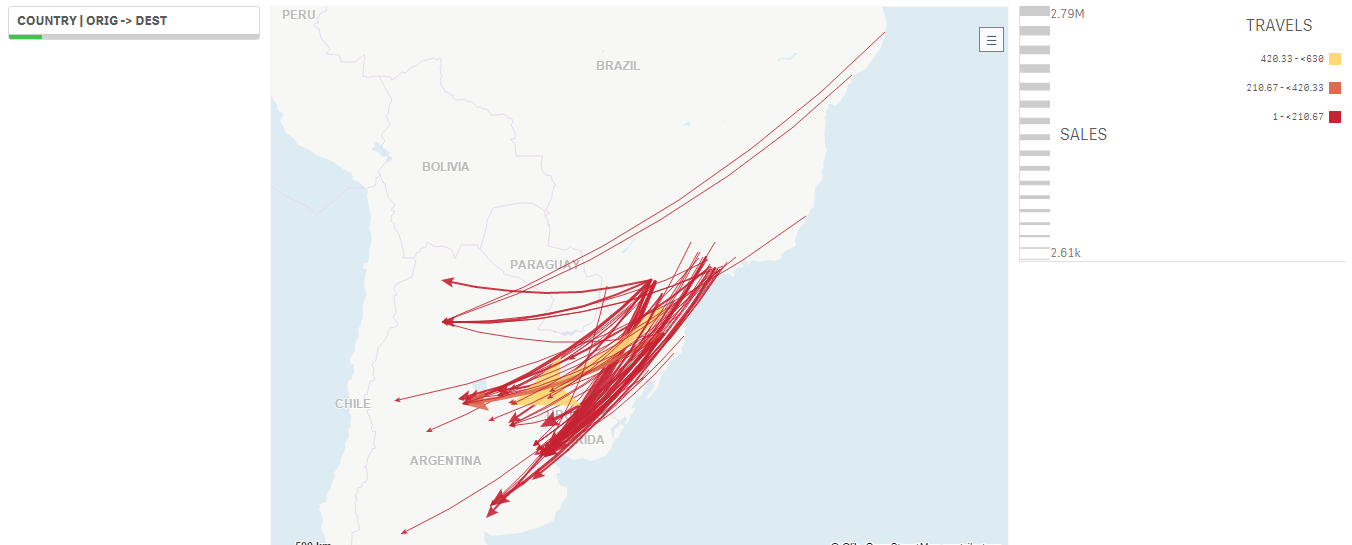
I also want to view DEST routes to the same ORIG (SCREEN 02: BRAZIL -> ARGENTINA) in any another color (blue, yellow, green)...
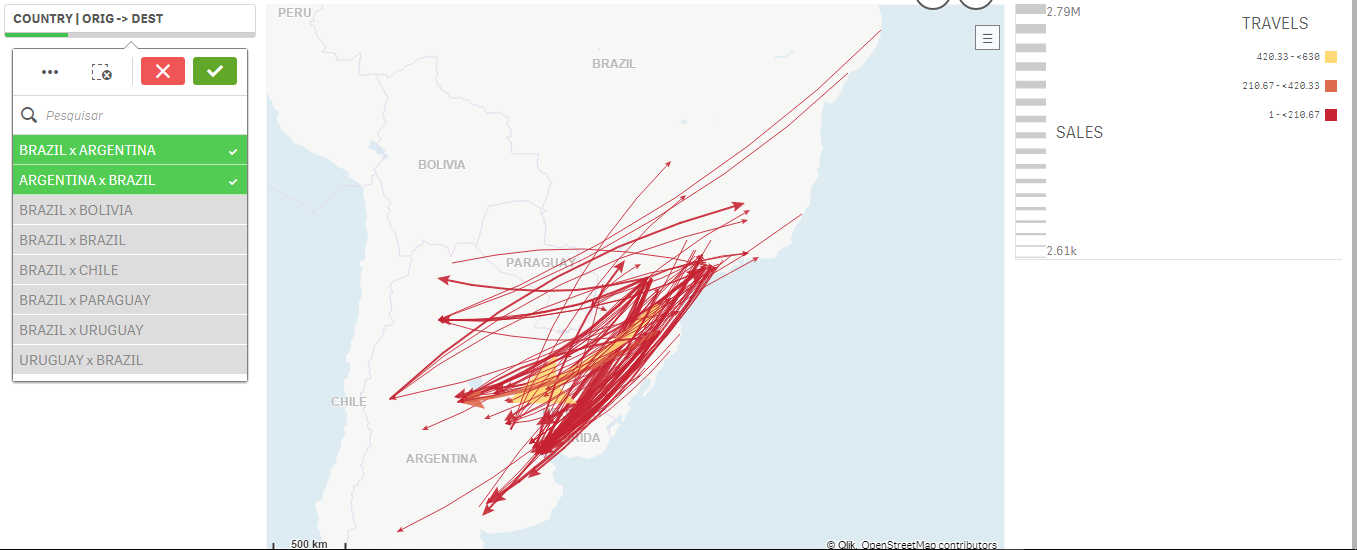
However, when I choose the two routes, it became a mess (SCREEN 03) ...
How to get ORIG x DEST (ARGENTINA -> BRAZIL) in red and DEST x ORIG (BRAZIL -> ARGENTINA) in any another color?
Could you help me please guys?
SCREEN 01:
SCREEN 02:
SCREEN 03:
- Mark as New
- Bookmark
- Subscribe
- Mute
- Subscribe to RSS Feed
- Permalink
- Report Inappropriate Content
Somebody help this man 
- Mark as New
- Bookmark
- Subscribe
- Mute
- Subscribe to RSS Feed
- Permalink
- Report Inappropriate Content
Try
Chart Properties >> Presentation >> Colors >> change color settings by dimension
- Mark as New
- Bookmark
- Subscribe
- Mute
- Subscribe to RSS Feed
- Permalink
- Report Inappropriate Content
Hello Govind,
Thanks for you help, however I've already tried this option. When the color is changed by dimension, all routes assumes the same color. Maybe some color expression?
- Mark as New
- Bookmark
- Subscribe
- Mute
- Subscribe to RSS Feed
- Permalink
- Report Inappropriate Content
Hi,
I suggest create a specific dimension for the routes.
Create a table to debug the coloring, make sure that the color expression evaluates for each route id.
Thanks,
Patric