Unlock a world of possibilities! Login now and discover the exclusive benefits awaiting you.

- Qlik Community
- :
- All Forums
- :
- GeoAnalytics
- :
- Re: GeoAnalytics - backgroud layer with a floorpla...
- Subscribe to RSS Feed
- Mark Topic as New
- Mark Topic as Read
- Float this Topic for Current User
- Bookmark
- Subscribe
- Mute
- Printer Friendly Page

 botldaniel
- Mark as New
- Bookmark
- Subscribe
- Mute
- Subscribe to RSS Feed
- Permalink
- Report Inappropriate Content
GeoAnalytics - backgroud layer with a floorplan - PNG - Meter system
Hi,
I’m using GeoAnalytics for displaying a background layer with a floorplan. I’ve added two layers:
- The background layer with an image (is a .PNG file) with the following dimensions 1356 X 877 (px).
- And a point layer with top left and bottom right point
I’m using a blanc base map and the projection is set to ‘defined meters’
The background layer is automatically zoomed and is displayed right, perfect!
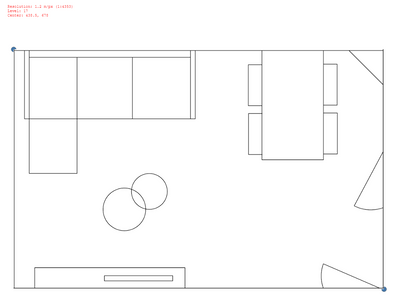
The dimensions of the room is 5.4 X 3.49 meters.
I've got a dataset for this room which includes 'meter' based data.
When i add a linelayer and set the requested fields, nothing wil be displayed. When i add a calculation *251 to the requested fields the line is visable.
- The line is displayed on the wrong postition
- The line layer is not zoomed / scaled relative to the background layer

What i do wrong?
Regards and thanks in advance,
Daniël

 Patric_Nordstro
- Mark as New
- Bookmark
- Subscribe
- Mute
- Subscribe to RSS Feed
- Permalink
- Report Inappropriate Content
If point layers is in the unit "meters" the points needs to be converted to pixels which is the coordinate system of the image.
- Pixel bounds: 1356 x 877
- Meter bounds: 5.4 x 3.49
So for instance the coordinate [2,3] meters becomes [1356/5.4 * 2 , 877/3.49 * 3]
Note that the map has origo in bottom left corner.
Thanks,
Patric
botldaniel
- Mark as New
- Bookmark
- Subscribe
- Mute
- Subscribe to RSS Feed
- Permalink
- Report Inappropriate Content
Hi Patric,
I read the most of your (geo) attributions on this forum. Thanks for your reply.
I have implemented the formule within my script. So the data is converted from meters to pixels. This is the result:

When zooming in on a part of the line that's outside the floorplan i see the following coordinates:

- Start
- X: 1029.5
- Y: 376.39
- End:
- X: 929.11
- Y: 552.83
These values can be plotted on the floorplan. I don't understand why the line is drawed outside the floorplan.
The data is calculated from the bottem left corner. So it's identical to the origo of the map?
Daniël
Patric_Nordstro- Mark as New
- Bookmark
- Subscribe
- Mute
- Subscribe to RSS Feed
- Permalink
- Report Inappropriate Content
@botldaniel I would plot the coordinates also using a point layer just make sure the calculations are correct.
Thanks,
Patric
