Unlock a world of possibilities! Login now and discover the exclusive benefits awaiting you.
- Qlik Community
- :
- All Forums
- :
- GeoAnalytics
- :
- Help Using GeoAnalytics Connector with Your Own Da...
- Subscribe to RSS Feed
- Mark Topic as New
- Mark Topic as Read
- Float this Topic for Current User
- Bookmark
- Subscribe
- Mute
- Printer Friendly Page
- Mark as New
- Bookmark
- Subscribe
- Mute
- Subscribe to RSS Feed
- Permalink
- Report Inappropriate Content
Help Using GeoAnalytics Connector with Your Own Data
I've been spending a good amount of time trying to learn GeoAnalytics. I've come to understand that while the extensions for the maps are great, the real power is in the Connector and the functions the wizard makes available. Best I can tell, the connector sends your data to the Idevio servers, where it is processed for the functions you would like to return, and then loads a table of data results to your Qlik Sense application for utilization by the maps.
So I have been playing with the samples here:
Guides & Examples « bi.idevio.com
Unfortunately, I cannot really figure out how to use my own data, primarily because I'm unable to figure out what the input values are that the wizard is expecting. Take the 'closest' example:.
I have two excel data files. One contains Lat/Long coordinates for Crimes that have occurred, and I load it into Qlik Sense named 'Crime'. The second file contains Lat/Long coodinates for Police Stations that exist, and I load it in names "Stations".
I then go into the GeoAnalytics Connector and open it up. That gives me this screen:
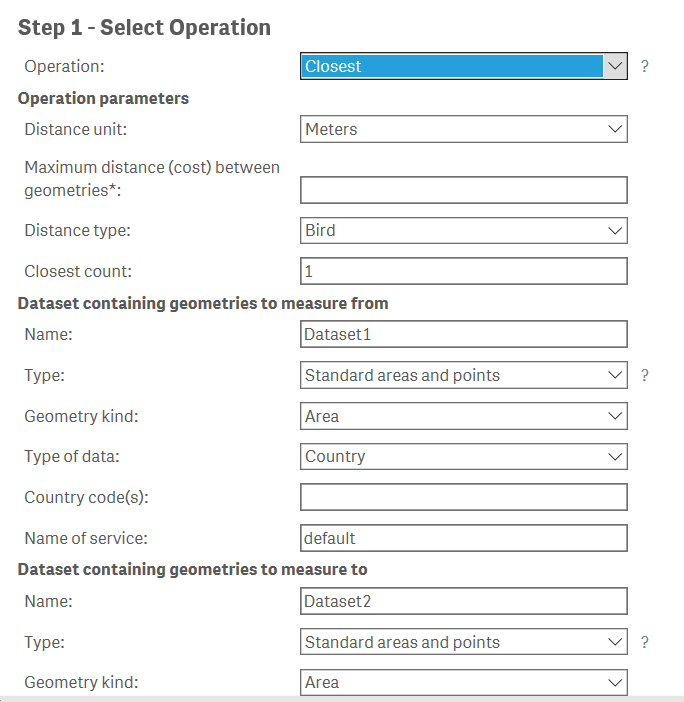
So the 1st section is pretty straight-forward. For the two Datasets, I believe I put "Crime" is as the Name. The Type is the 1st confusing item. From my investigation, I think the "Standard areas and points" just uses sample data from Idevio, and thus leaving this as the option would NOT use my Lat/Long data. So I think I need to change this. Here are the options:
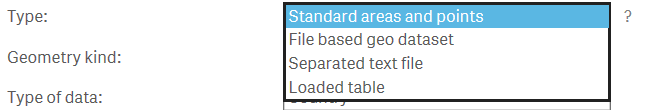
The option that seems to make the most sense is "Loaded table". Switching to this gives me these options:
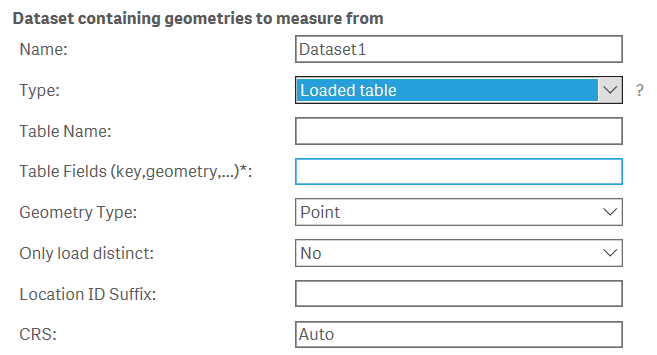
So for the table name, I believe I would use the name of the table defined in the data load editor:
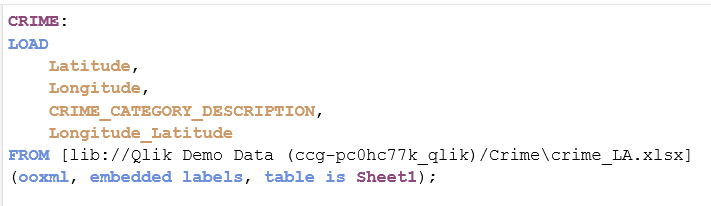
So I enter "Sheet1" as the Table Name. But the table name input is the next confusing piece. Do I enter the 4 columns in this table? Or is it specifically looking for things like key, geometry? Aren't these the values that the server will send BACK to me as output? Doesn't GeoAnalytics take my data, fine the closest points, and create a table I can then use for the mapping? I am confused on this data entry point. I haven't been able to make this piece work yet to actually return true closest values...I am stuck.
Not to further confuse all of this, but many of the functions ask for the "Type of Data", which gives these options:
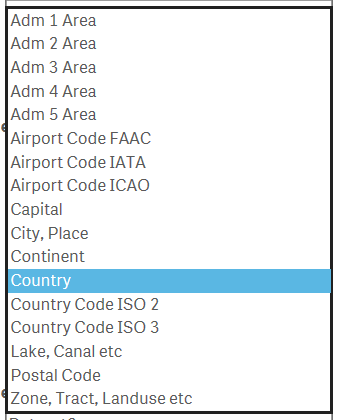
What do the 1st 5 areas mean? Why is there no Lat/Long as an option here? There also is no street address option. This is also confusing.
Sorry for the long post, but could REALLY use help if anyone knows how this works. Thank you!
- « Previous Replies
-
- 1
- 2
- Next Replies »
- Mark as New
- Bookmark
- Subscribe
- Mute
- Subscribe to RSS Feed
- Permalink
- Report Inappropriate Content
This is normally down to missing latitude / longitude points or some other missing data that is being used by the connector - each row it is working through has to have valid data - I would check using tables to make sure that there isn't anything missing as a start point. You can also check the log files:
C:\ProgramData\QlikTech\Custom Data\IdevioGeoAnalyticsConnector\Log
as that should also help out.
- « Previous Replies
-
- 1
- 2
- Next Replies »