Unlock a world of possibilities! Login now and discover the exclusive benefits awaiting you.
- Qlik Community
- :
- All Forums
- :
- GeoAnalytics
- :
- Info Bubble : how to include the map layer name ?
- Subscribe to RSS Feed
- Mark Topic as New
- Mark Topic as Read
- Float this Topic for Current User
- Bookmark
- Subscribe
- Mute
- Printer Friendly Page
- Mark as New
- Bookmark
- Subscribe
- Mute
- Subscribe to RSS Feed
- Permalink
- Report Inappropriate Content
Info Bubble : how to include the map layer name ?
Hi everyone,
I have created a 'Info Bubble' on my Area Layer that shows a summary of measures for an area but what I do not know
how to do is show the Area Layer in the bubble as well.
I would like the area layer value to show in the bubble without selections being made first, is this at all possible in QGA ?
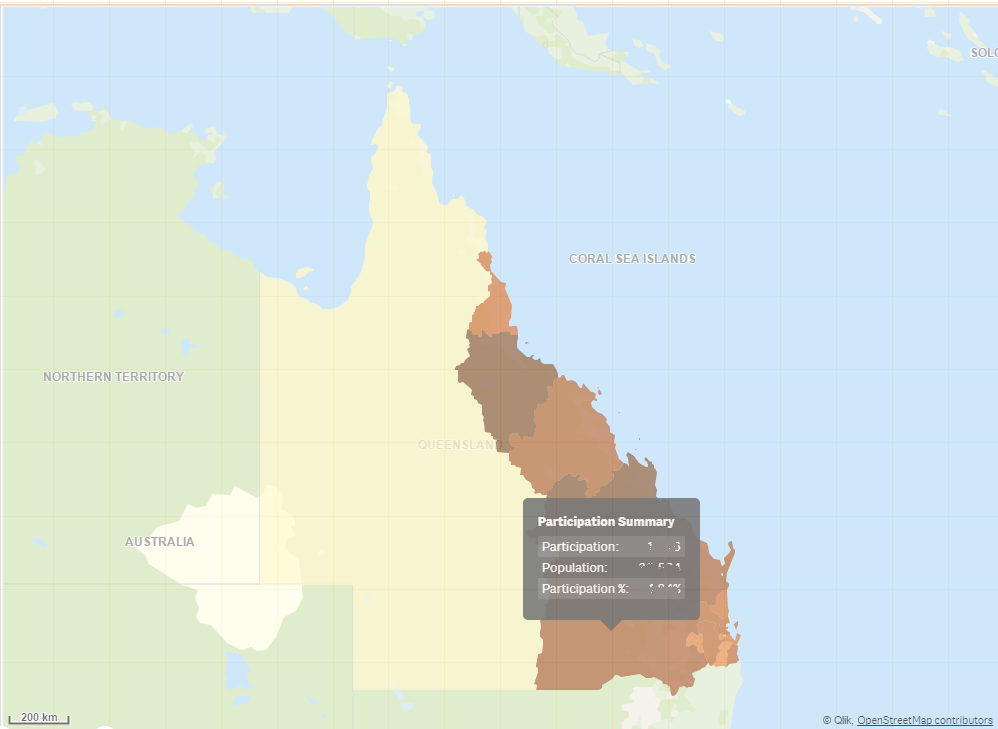
Here's a screen shot of the current map, the coloured areas are the Statistical Areas in our state of Queensland (Aust) so
as you can see the info bubble shows my calcs, nothing is selected in the sheet other than a Year (e.g 2016) , hence if I can
figure out the way to capture the area name , I will be very happy 
Thanks in advance
Paul
- Tags:
- info bubble
- layers
- Mark as New
- Bookmark
- Subscribe
- Mute
- Subscribe to RSS Feed
- Permalink
- Report Inappropriate Content
Hi Paul,
I'm not sure I'm understanding the issue correctly, but I think you are just trying to show the area name in the info bubble along with the measures? All you should need to do is include the area name in your calculated info. Here's an example from one of my apps:
='Point: ' & [Service name] &'</BR>'
&'Area: ' & ACPR &'</BR>'
&'Recipients: ' & Sum([Number of recipients])
The "point" in this case is the location of a service (Service name), the Area should be fairly self explanatory, in this case it is an aged care planning region associated with the service location. This works regardless of whether any selections are made or not provided the dimension I have in the layer I'm using this for is appropriate to what I want to show. So in your case as long as you have some sort of unique area ID as your dimension it should be straight forward.
Hope this helps.
- Mark as New
- Bookmark
- Subscribe
- Mute
- Subscribe to RSS Feed
- Permalink
- Report Inappropriate Content
Hi Rod,
Thanks for your reply, I agree I can surface a layer name using the above as suggested, but if the user drills down to lower layers then I need to show those in the bubble. As you're local then you'd understand when I talk about the ABS SA layers, so at the top level the user sees SA4 in the bubble (using your example), then if they click to drill down to SA3 then SA3 needs to show in the bubble and so forth down to SA2.
I guess I can test selections once SA4 has been clicked on the layer.
I was trying to avoid too much code in the bubble, or I'm just heading down the incorrect path in my thinking.
Cheers
Paul
- Mark as New
- Bookmark
- Subscribe
- Mute
- Subscribe to RSS Feed
- Permalink
- Report Inappropriate Content
I see what you are after. I think you are on the right path in that you would have to test the selections, but perhaps a somewhat simpler way to do this would be to embed a chart or table in the pop-up. This might make it easier to manage and avoid a whole lot of mucking around in expressions.
While I said "simpler", that probably depends on your perspective as you have to include a little javascript in the pop-up definition. Here's an example where I'm calling another chart within the same app (that I have reduced down to a single grid-cell in size next to the map):
'<div id="diagram1" style="position: relative; width: 200px; height: 300px;"></div>' &
'<script>var app = qlik.currApp(); app.variable.setContent("vCurrLGA","'&[LGA Name]&'"); app.getObject("diagram1","pHEubD",{noSelections: false});</script>'
This html/javascript is formatting a size/shape for the chart and then the script section is setting a dimension selection for the chart (LGA Name)and calling the chart object by it's ID (pHEubD). You can find the object ID a number of ways but personally I just use the devhub's single configurator to view it.
- Mark as New
- Bookmark
- Subscribe
- Mute
- Subscribe to RSS Feed
- Permalink
- Report Inappropriate Content
Thanks Rod I will give this a try.