Unlock a world of possibilities! Login now and discover the exclusive benefits awaiting you.
- Qlik Community
- :
- All Forums
- :
- GeoAnalytics
- :
- Re: Qlik GeoAnalytics Indoors map
- Subscribe to RSS Feed
- Mark Topic as New
- Mark Topic as Read
- Float this Topic for Current User
- Bookmark
- Subscribe
- Mute
- Printer Friendly Page
- Mark as New
- Bookmark
- Subscribe
- Mute
- Subscribe to RSS Feed
- Permalink
- Report Inappropriate Content
Qlik GeoAnalytics Indoors map
Hi,
It's possible to create an indoor map (based on scanned plan) or use a picture as raster?
Like this, blue zones are stored in KML file.
- Tags:
- qlik geoanalytics
Accepted Solutions
- Mark as New
- Bookmark
- Subscribe
- Mute
- Subscribe to RSS Feed
- Permalink
- Report Inappropriate Content
Hi,
Thank you. But I want to show a image as a raster. I have done that but it's not very very simple...
I georeference a image with QGIS, next I export in tiff format then I import in MapBox and I display the result with a GeoData Layer.
PS: When we will can use the standard help website with Qlik GeoAnalytics ? the current GeoAnalytics Reference it's not very user friendly...
- Mark as New
- Bookmark
- Subscribe
- Mute
- Subscribe to RSS Feed
- Permalink
- Report Inappropriate Content
Hi, you can use various of formats as input, please take a look here: GeoAnalytics Reference
When applicable please mark the appropriate replies as CORRECT. This will help community members and Qlik Employees know which discussions have already been addressed and have a possible known solution. Please mark threads as HELPFUL if the provided solution is helpful to the problem, but does not necessarily solve the indicated problem. You can mark multiple threads as HELPFUL if you feel additional info is useful to others.
Regards,
Jonas Karlsson
Qlik
- Mark as New
- Bookmark
- Subscribe
- Mute
- Subscribe to RSS Feed
- Permalink
- Report Inappropriate Content
Hi,
Thank you. But I want to show a image as a raster. I have done that but it's not very very simple...
I georeference a image with QGIS, next I export in tiff format then I import in MapBox and I display the result with a GeoData Layer.
PS: When we will can use the standard help website with Qlik GeoAnalytics ? the current GeoAnalytics Reference it's not very user friendly...
- Mark as New
- Bookmark
- Subscribe
- Mute
- Subscribe to RSS Feed
- Permalink
- Report Inappropriate Content
Aurelien,
Would you share your Mapbox process; starting with the import of the tif file to generating the output for loading? I have created the georeferenced image with QGIS and need some help with the next steps.
Thanks in advance for your help.
Regards,
Amy
- Mark as New
- Bookmark
- Subscribe
- Mute
- Subscribe to RSS Feed
- Permalink
- Report Inappropriate Content
Hi Aurelien,
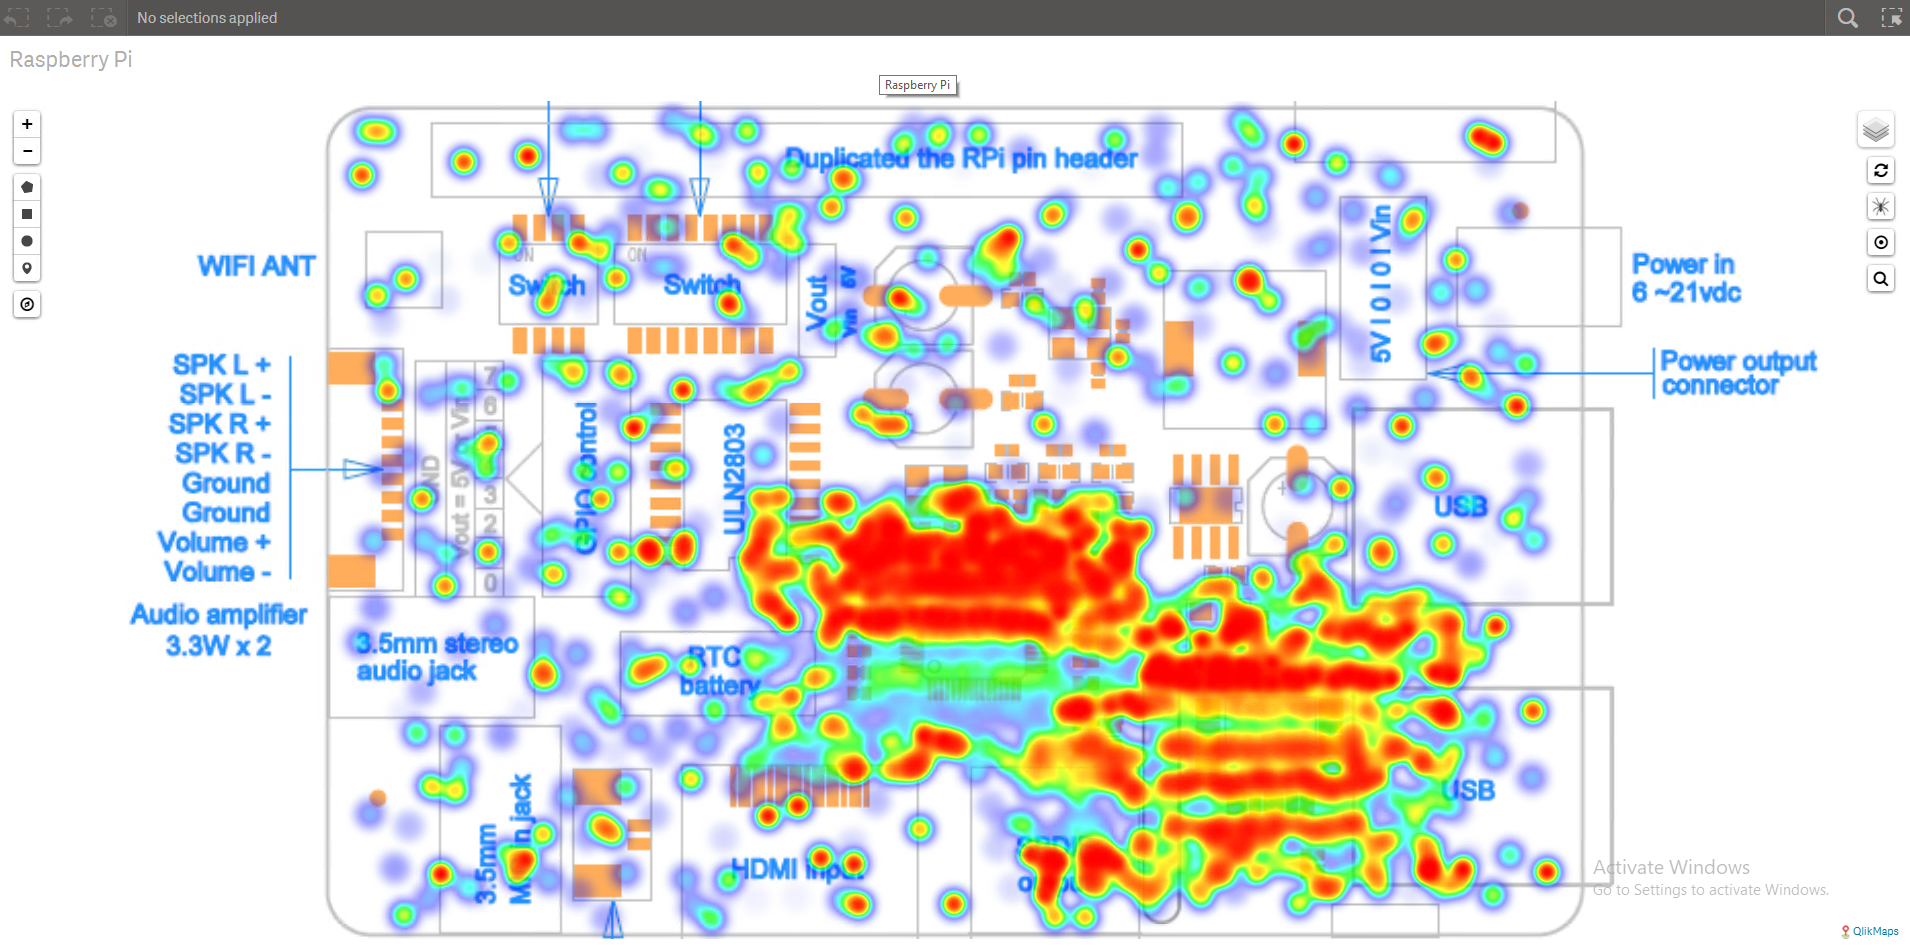
I can't speak for doing it in Qlik GeoAnalytics but I can say that it's rather easy in QlikMaps.
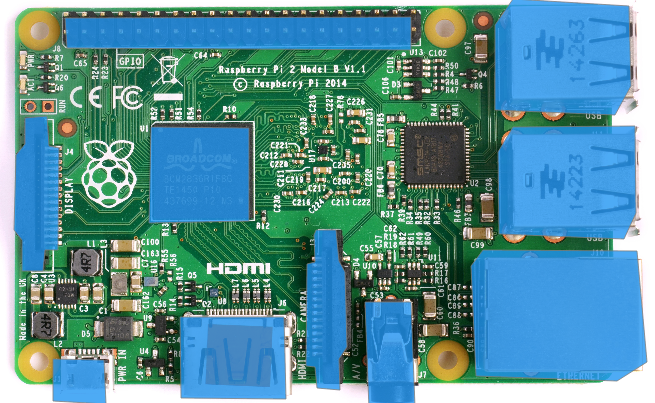
In this image I simply loaded a .png file in as the base map and used heat readings at various points around the board. I then scaled the points to match the image on the board and got the image you see below.
- Mark as New
- Bookmark
- Subscribe
- Mute
- Subscribe to RSS Feed
- Permalink
- Report Inappropriate Content
Hi Trey,
Great map 
In ArticqueMap for Qlik* it's also simple (image in my first message), but not with GeoAnalytics.
I have found a "solution":
- Create a KML representing my Raspberry (for Rasp it easy but if I want a human body it's not the same thing...)
- Use it in area layer (no selectionable)
- Use empty raster for my map
Aurélien