Unlock a world of possibilities! Login now and discover the exclusive benefits awaiting you.
- Qlik Community
- :
- All Forums
- :
- GeoAnalytics
- :
- Re: waterfall plot
- Subscribe to RSS Feed
- Mark Topic as New
- Mark Topic as Read
- Float this Topic for Current User
- Bookmark
- Subscribe
- Mute
- Printer Friendly Page
- Mark as New
- Bookmark
- Subscribe
- Mute
- Subscribe to RSS Feed
- Permalink
- Report Inappropriate Content
waterfall plot
Hi all,
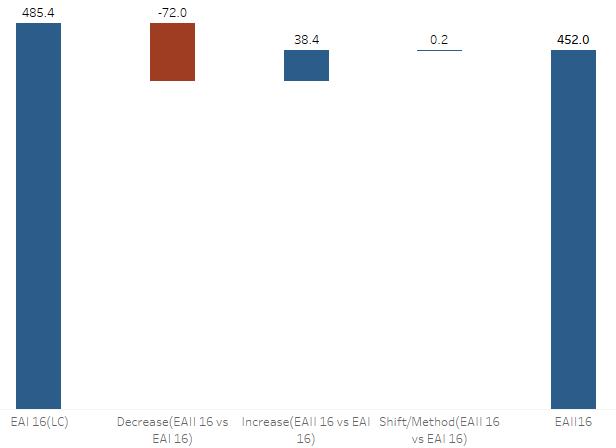
I wanna develop waterfall plot with QlikView just like the printscreen, what should I do?
thanks a million
Ryan
- « Previous Replies
-
- 1
- 2
- Next Replies »
- Mark as New
- Bookmark
- Subscribe
- Mute
- Subscribe to RSS Feed
- Permalink
- Report Inappropriate Content
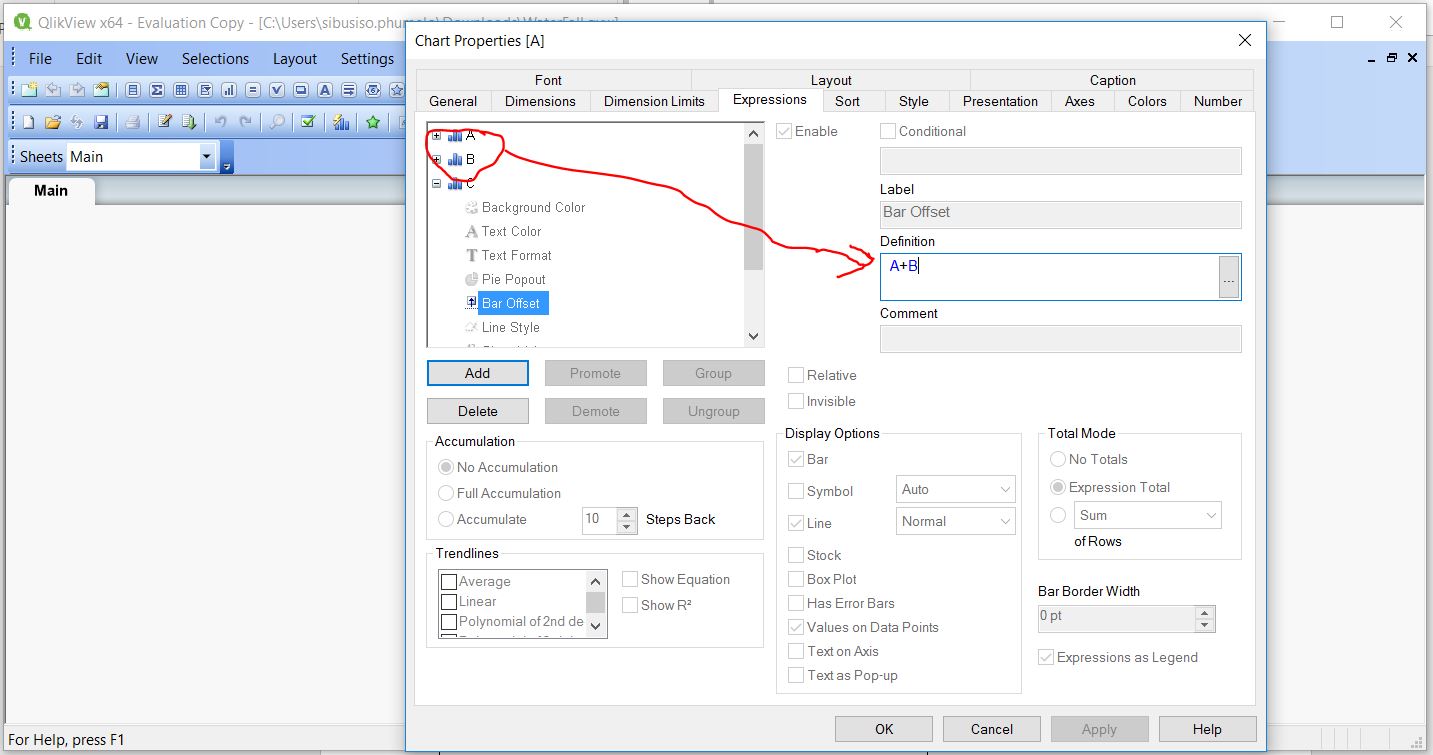
You will have to do that on the offset under the expression. look at the picture below and also find the QVW as well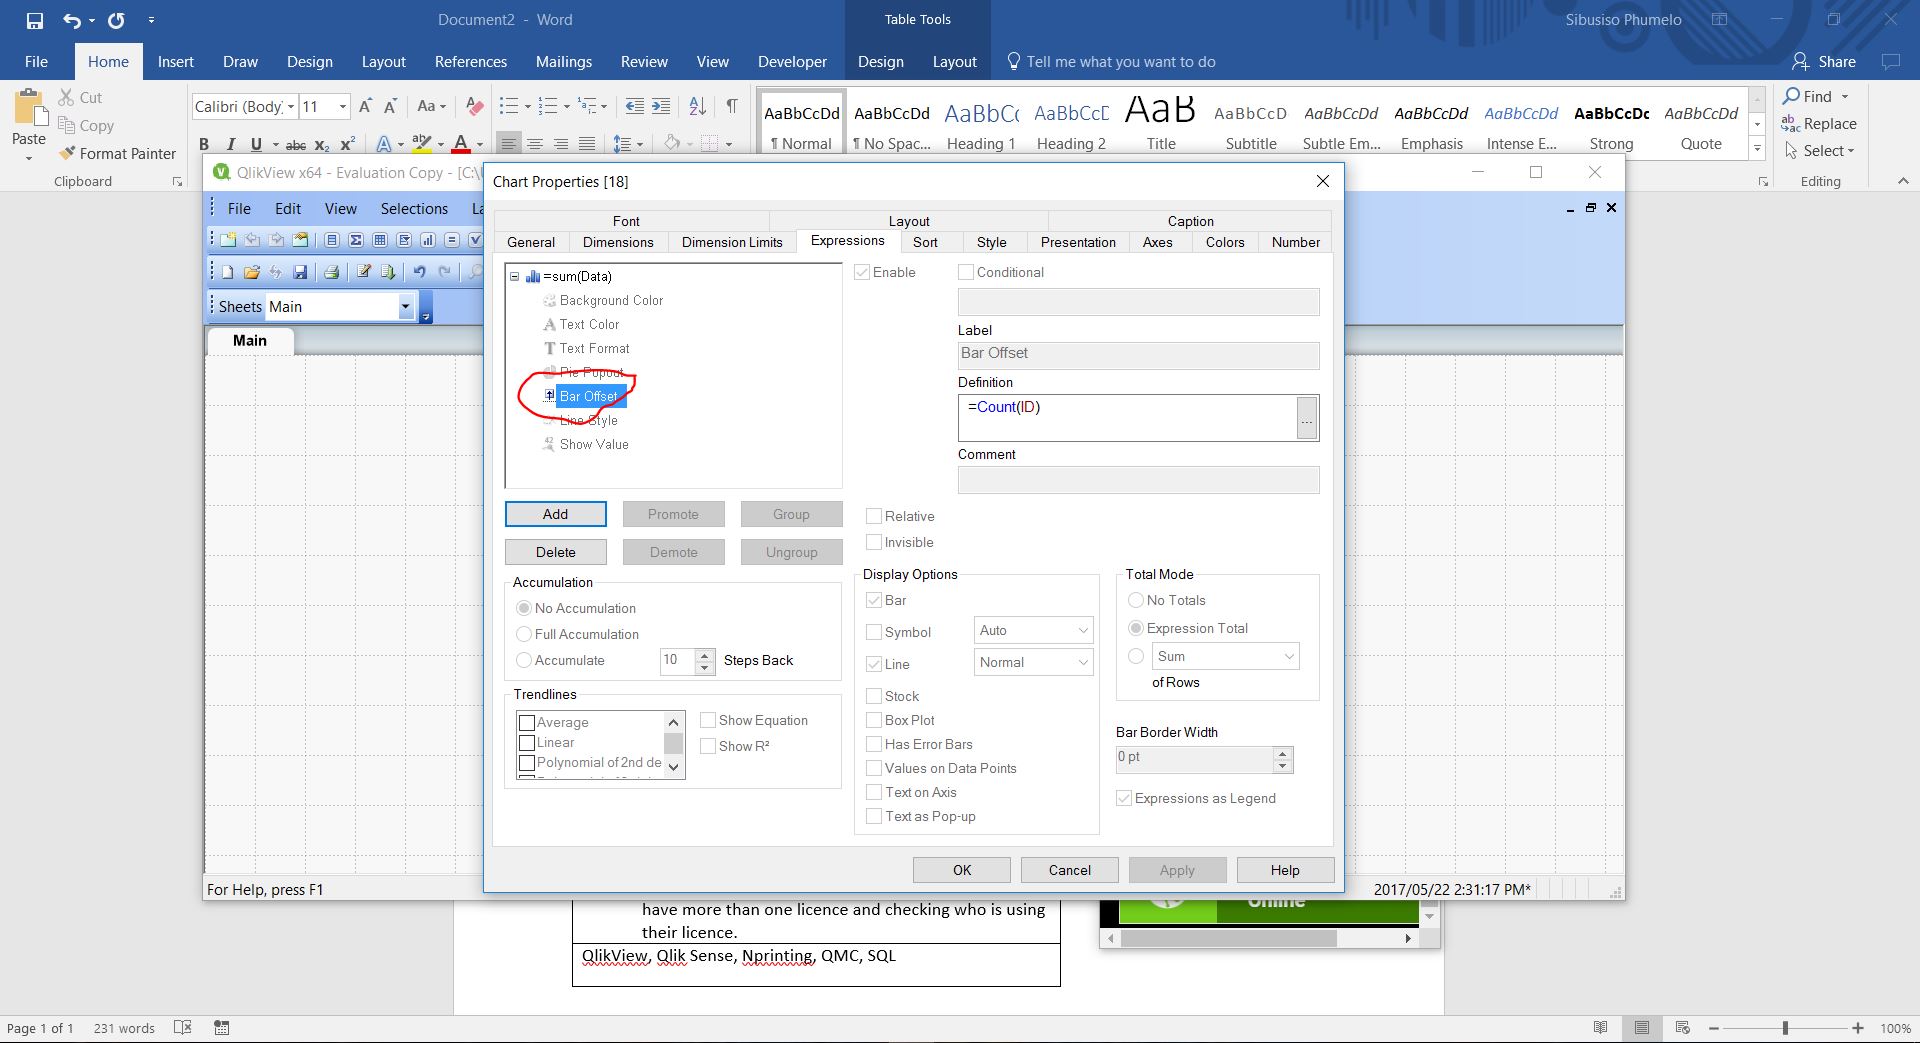
- Mark as New
- Bookmark
- Subscribe
- Mute
- Subscribe to RSS Feed
- Permalink
- Report Inappropriate Content
Dear,
I tried as what you said ,but still can't solve my problem.
There are 5 pillars in the waterfall chart, the value of first one is 485.4,and the second one will decrease 72 based on the height of the first, the third will add 38.4 based on the height of the second one, and so on, the height of the last one is 452.0.......
that's what I want......
what should I do , I have no idea.......
- Mark as New
- Bookmark
- Subscribe
- Mute
- Subscribe to RSS Feed
- Permalink
- Report Inappropriate Content
You can use your expression per bar, but you will have an idea of what to do now.
- Mark as New
- Bookmark
- Subscribe
- Mute
- Subscribe to RSS Feed
- Permalink
- Report Inappropriate Content
This is what you will have at the end of the bar chart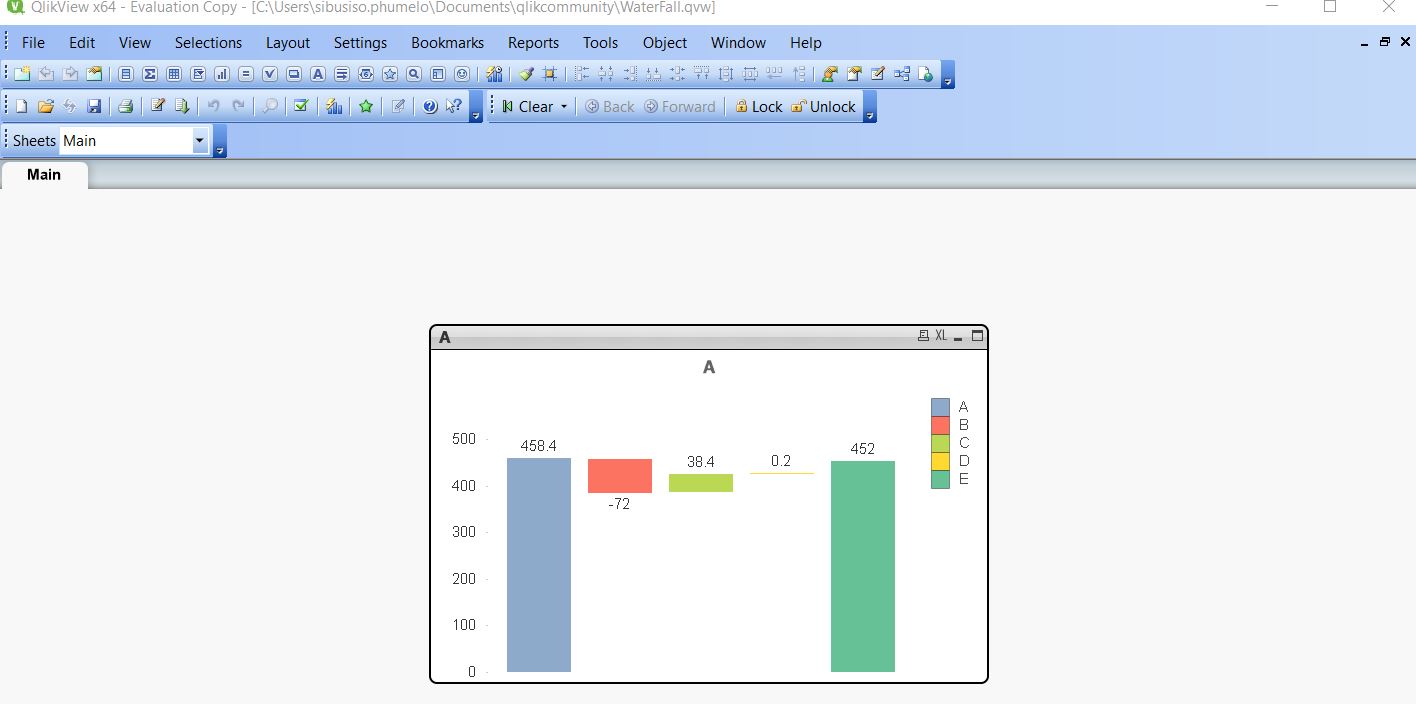
- Mark as New
- Bookmark
- Subscribe
- Mute
- Subscribe to RSS Feed
- Permalink
- Report Inappropriate Content
yes, that's what I want, can you send me the demo or tell me how to edit expression.
thanks a million
- Mark as New
- Bookmark
- Subscribe
- Mute
- Subscribe to RSS Feed
- Permalink
- Report Inappropriate Content
Please refer to this
- Mark as New
- Bookmark
- Subscribe
- Mute
- Subscribe to RSS Feed
- Permalink
- Report Inappropriate Content
where is the reference??
many thanks
- Mark as New
- Bookmark
- Subscribe
- Mute
- Subscribe to RSS Feed
- Permalink
- Report Inappropriate Content
You can use the name of the expression as the reference of the above expression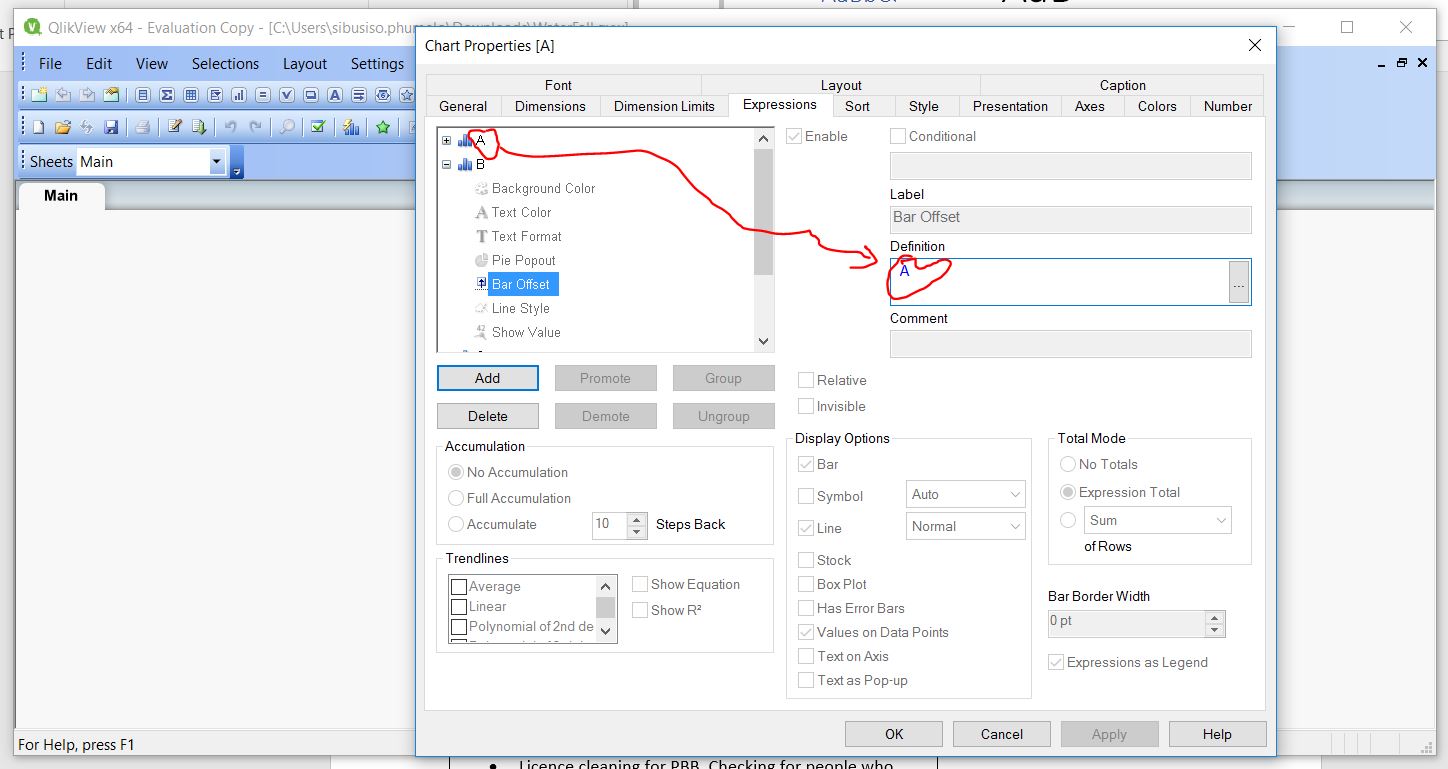
- Mark as New
- Bookmark
- Subscribe
- Mute
- Subscribe to RSS Feed
- Permalink
- Report Inappropriate Content
When you have found your solution please mark as correct and the ones which were helpful please mark as helpful so that you can also help others with your question and so that other people don't respond endlessly while you have the response
- « Previous Replies
-
- 1
- 2
- Next Replies »