Unlock a world of possibilities! Login now and discover the exclusive benefits awaiting you.
- Qlik Community
- :
- Forums
- :
- Analytics & AI
- :
- Products & Topics
- :
- Integration, Extension & APIs
- :
- Gauge Bar Chart Extension In Qlik Sense
- Subscribe to RSS Feed
- Mark Topic as New
- Mark Topic as Read
- Float this Topic for Current User
- Bookmark
- Subscribe
- Mute
- Printer Friendly Page
- Mark as New
- Bookmark
- Subscribe
- Mute
- Subscribe to RSS Feed
- Permalink
- Report Inappropriate Content
Gauge Bar Chart Extension In Qlik Sense
Hi,
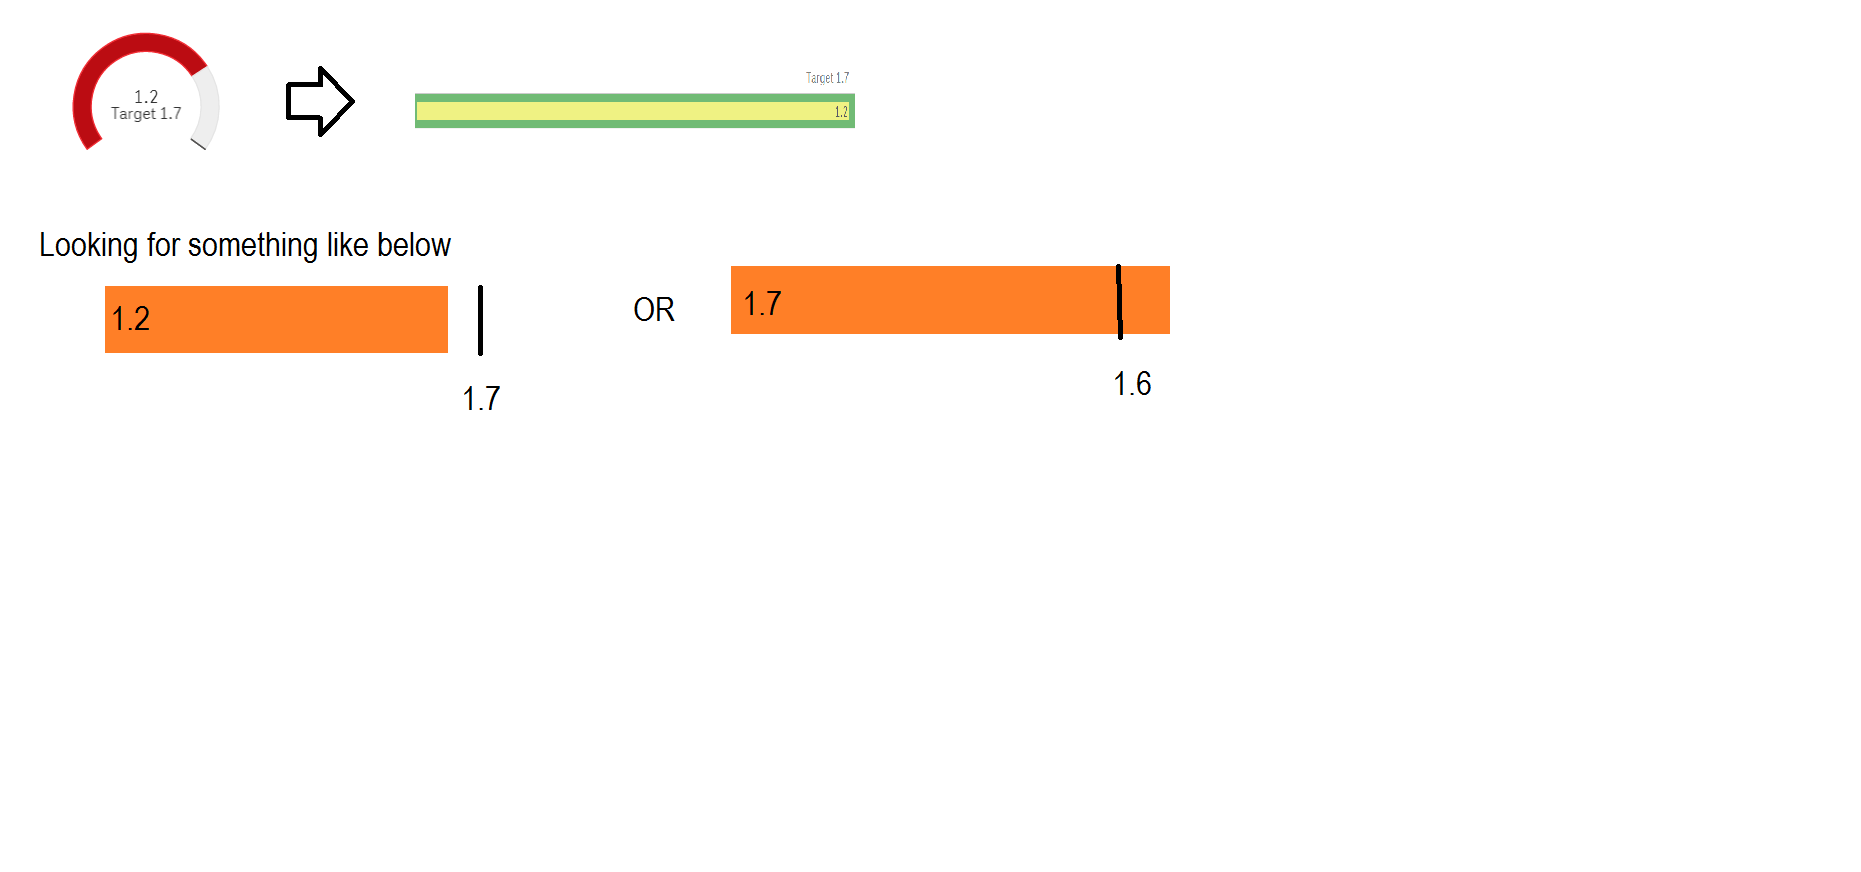
I am looking for Gauge Chart Extension to show stacked bar chart with Actual and Target Value [Single Bar Chart].
There are specific requirement to have actual value label printed on bar chart and also to show target line on bar and bar & width of bar chart can be adjustable as well.
Can you please suggest any Qlik Sense Extension for same.
Example Attached.
Thanks
- Mark as New
- Bookmark
- Subscribe
- Mute
- Subscribe to RSS Feed
- Permalink
- Report Inappropriate Content
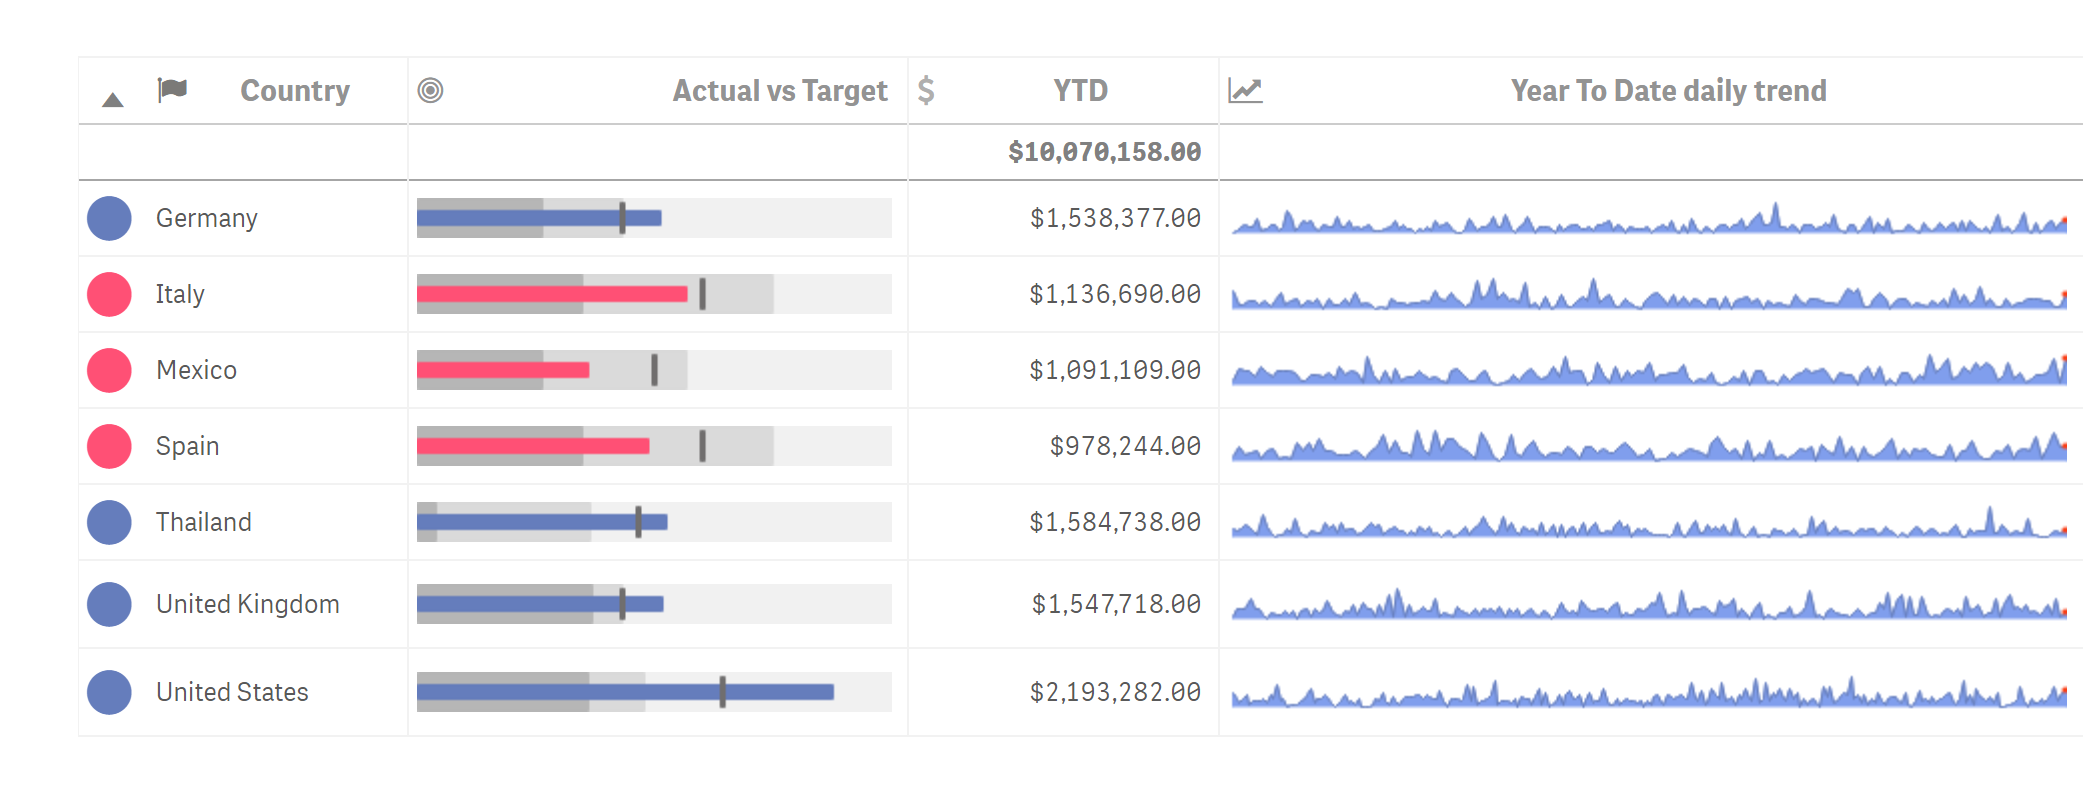
Have a look at the Vizlib table which has a mini-chart of type bar as a column option in the table - it might do what you want:
- Mark as New
- Bookmark
- Subscribe
- Mute
- Subscribe to RSS Feed
- Permalink
- Report Inappropriate Content
Thanks for replying
I have tried to convert my Gauge chart to the Vizlib table - Mini Chart Type, Some how it is not appearing with actual and target mark on the bar. Please see the attached screenshot.
Let me know if we can directly convert that Qlik Sense Chart to Vizlib table - Mini Chart. Any example will be / steps will be great helpful.
In attached image black line on bar is = Target Value and Bar = Actual Value
Thanks
- Mark as New
- Bookmark
- Subscribe
- Mute
- Subscribe to RSS Feed
- Permalink
- Report Inappropriate Content
I depends on how you have configured the Vizlib table and also on your Qlik data model.
It is hard to suggest anything unless your share more about the configuration you didn't get to work in Vizlib table and the particulars of your Qlik data model.