Unlock a world of possibilities! Login now and discover the exclusive benefits awaiting you.
- Qlik Community
- :
- Forums
- :
- Analytics & AI
- :
- Products & Topics
- :
- Integration, Extension & APIs
- :
- Is it possible to return dataframe from R and show...
- Subscribe to RSS Feed
- Mark Topic as New
- Mark Topic as Read
- Float this Topic for Current User
- Bookmark
- Subscribe
- Mute
- Printer Friendly Page
- Mark as New
- Bookmark
- Subscribe
- Mute
- Subscribe to RSS Feed
- Permalink
- Report Inappropriate Content
Is it possible to return dataframe from R and show in a QS table?
Hi,
Is it possible to return a data frame from R and show the data in a Qliksense table?
Say I have some dimension list that I select and that gets passed into R and then R returns a dataframe that I show in a table.
Appreciate any help on this.
Thanks.
- Mark as New
- Bookmark
- Subscribe
- Mute
- Subscribe to RSS Feed
- Permalink
- Report Inappropriate Content
Could you post here an example?
- Mark as New
- Bookmark
- Subscribe
- Mute
- Subscribe to RSS Feed
- Permalink
- Report Inappropriate Content
Hello,
you can use this at first
Installing R with Qlik Sense.pdf
After the Installation you can use:
1. The Advanced Analytics Toolbox
Under the Point Installation (in GitHub) you find the required R Packages you need to install for this Extension
2. The Advanced Analytics Expression Builder
If you only want to use Expressions in the Qlik Sense Visualizations.
- Mark as New
- Bookmark
- Subscribe
- Mute
- Subscribe to RSS Feed
- Permalink
- Report Inappropriate Content
My solution is:
- sent a vector or few vectors from Qlik
- put them together in R script as a data frame
- do the analytics
- get a single column/vector from that dataframe in R as a output
- show it in a calculation field as a single column
- repeat it as many times as many columns from R (based on the input data) you need in Qlik - so every measure in Qlik is single column from output data frame from R
- Mark as New
- Bookmark
- Subscribe
- Mute
- Subscribe to RSS Feed
- Permalink
- Report Inappropriate Content
- Mark as New
- Bookmark
- Subscribe
- Mute
- Subscribe to RSS Feed
- Permalink
- Report Inappropriate Content
Hi jamajka1, akarolewski, hf-group
Just to illustrate what I am trying to do in R I am running the following:
load("Data/Weighted_Values.RData");
ts <- data.frame(TS)
The output of 'ts' can be viewed in the following image:
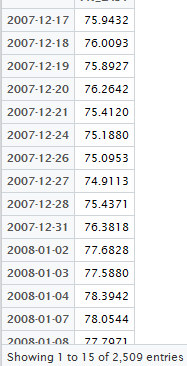
I would like to show this result in a time series line chart in Qlik Sense.
I have the Date as dimension in my QS data model. I would like to map the date to the corresponding values returned.
Thanks.
- Mark as New
- Bookmark
- Subscribe
- Mute
- Subscribe to RSS Feed
- Permalink
- Report Inappropriate Content
In the Qlik Sense February 2018 release, support have been added for returning a whole table (dataframe) from the plugin to Qlik in a single request, when called from the Qlik Sense load script. This means that you can add a dataframe from R as a table in the Qlik data model during data reload.
So stay tuned for the Feb 2018 release where more information will come regarding this.
- Mark as New
- Bookmark
- Subscribe
- Mute
- Subscribe to RSS Feed
- Permalink
- Report Inappropriate Content
Thanks tln. Look forward to the Feb 2018 release to make use of this feature.
I have been able to get the values from the dataframe to load into my chart at runtime using an expressions such as below:
R.ScriptEvalEx( 'S', 'load(paste("\\\\servename\\Data\\",q$DatasetName[1],".RData",sep="")); TS;' , DatasetName As DatasetName)