Unlock a world of possibilities! Login now and discover the exclusive benefits awaiting you.
- Qlik Community
- :
- Forums
- :
- Analytics & AI
- :
- Products & Topics
- :
- Integration, Extension & APIs
- :
- Re: Qlik Open Data Challenge - Across Borders usin...
- Subscribe to RSS Feed
- Mark Topic as New
- Mark Topic as Read
- Float this Topic for Current User
- Bookmark
- Subscribe
- Mute
- Printer Friendly Page
- Mark as New
- Bookmark
- Subscribe
- Mute
- Subscribe to RSS Feed
- Permalink
- Report Inappropriate Content
Qlik Open Data Challenge - Across Borders using EngineAPI
Hey all, just wanted to encourage everyone to go check out the Qlik Open Data Challenge and vote!
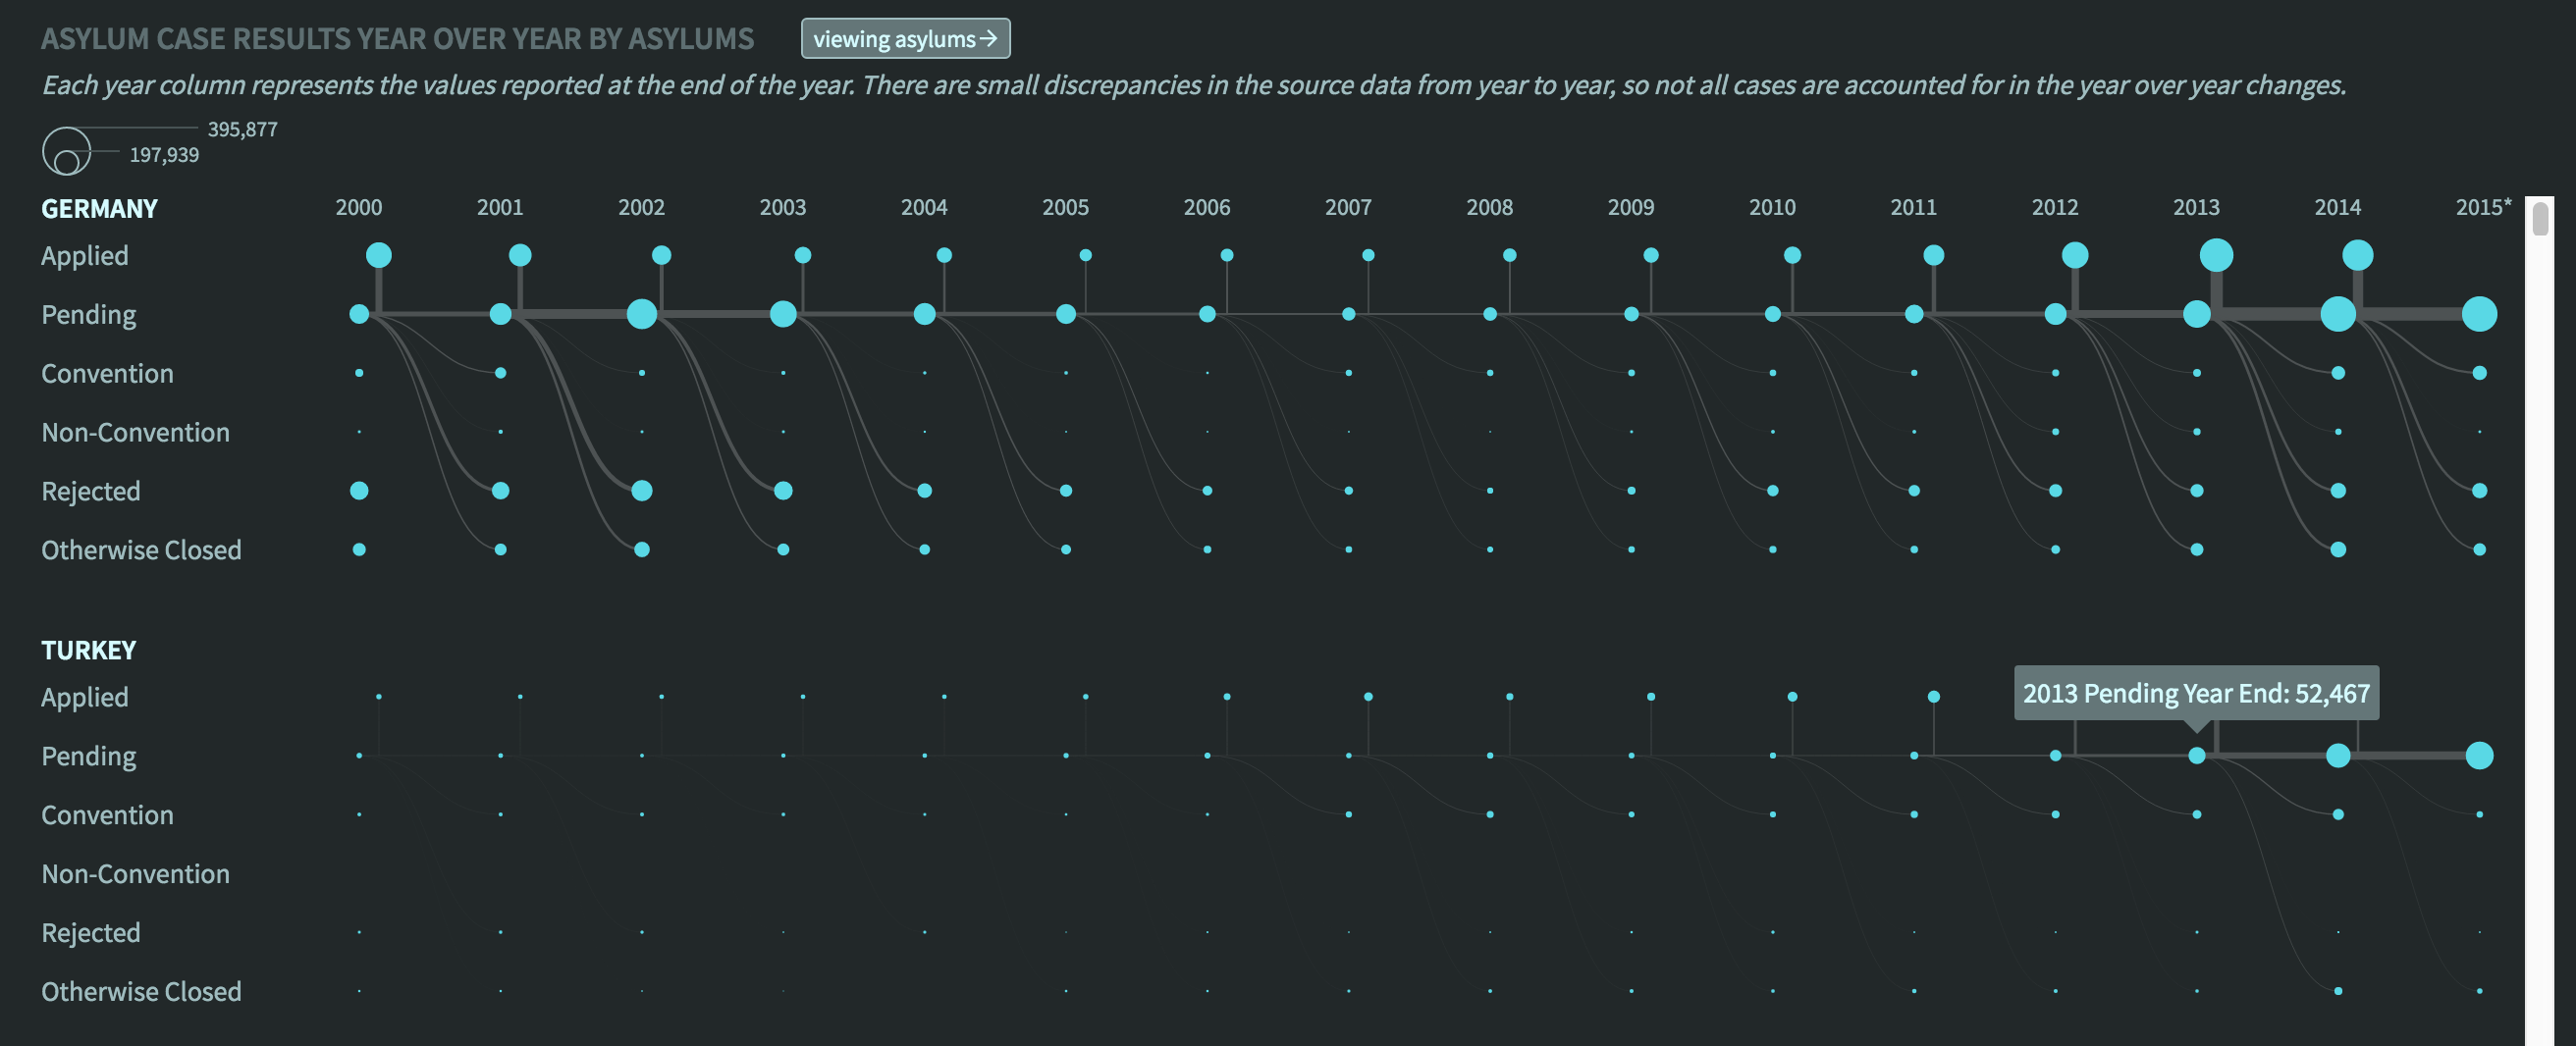
I submitted an app in the challenge called "Across Borders" that analyzes refugee data coming from UNHCR and cross references it with other data and news sources, such as the World Bank and BBC News. The app is built as a custom web visualization that uses the Qlik EngineAPI extensively to integrate QIX data with a variety of technologies, including AngularJS for the UI, D3 for custom visualizations, and Mapbox GL for custom mapping.
I'll be writing some blog posts in the future about how it was built and sharing some tricks I learned along the way.
You can see all of the finalists and vote at Take Action Open Data Challenge | Qlik
Thanks!
Speros

- Mark as New
- Bookmark
- Subscribe
- Mute
- Subscribe to RSS Feed
- Permalink
- Report Inappropriate Content
Looks really good! Congrats!
- Mark as New
- Bookmark
- Subscribe
- Mute
- Subscribe to RSS Feed
- Permalink
- Report Inappropriate Content
Thank you!
- Mark as New
- Bookmark
- Subscribe
- Mute
- Subscribe to RSS Feed
- Permalink
- Report Inappropriate Content
Pretty impressive Speros. Had a brief moment of "that can't be Qlik Sense?!"
I was wondering, what is the chart called in the screen shot?
Also did you use any D3 libraries, or was it all built from the raw framework?
Graham
- Mark as New
- Bookmark
- Subscribe
- Mute
- Subscribe to RSS Feed
- Permalink
- Report Inappropriate Content
I'm not sure that chart has a specific name, I would qualify it as a flow diagram of some sort. Similar concept to a Sankey, etc
No D3 libraries, all charts were built ground up using the core D3 library
- Mark as New
- Bookmark
- Subscribe
- Mute
- Subscribe to RSS Feed
- Permalink
- Report Inappropriate Content
Great work Speros !!!. Congrats !!!
- Mark as New
- Bookmark
- Subscribe
- Mute
- Subscribe to RSS Feed
- Permalink
- Report Inappropriate Content
Hi Speros,
Congrats on winning.
Can you let us know when you build the Blog explaining how this app built.
Thanks