Unlock a world of possibilities! Login now and discover the exclusive benefits awaiting you.
Announcements
Now accepting applications for the Qlik Luminary and Partner Ambassador Programs: Apply by July 6!
- Qlik Community
- :
- Forums
- :
- Analytics & AI
- :
- Products & Topics
- :
- Integration, Extension & APIs
- :
- Qlik Sense Stream Graph extension
Options
- Subscribe to RSS Feed
- Mark Topic as New
- Mark Topic as Read
- Float this Topic for Current User
- Bookmark
- Subscribe
- Mute
- Printer Friendly Page
Turn on suggestions
Auto-suggest helps you quickly narrow down your search results by suggesting possible matches as you type.
Showing results for
Partner Ambassador
2015-11-13
07:20 PM
- Mark as New
- Bookmark
- Subscribe
- Mute
- Subscribe to RSS Feed
- Permalink
- Report Inappropriate Content
Qlik Sense Stream Graph extension
Hi all,
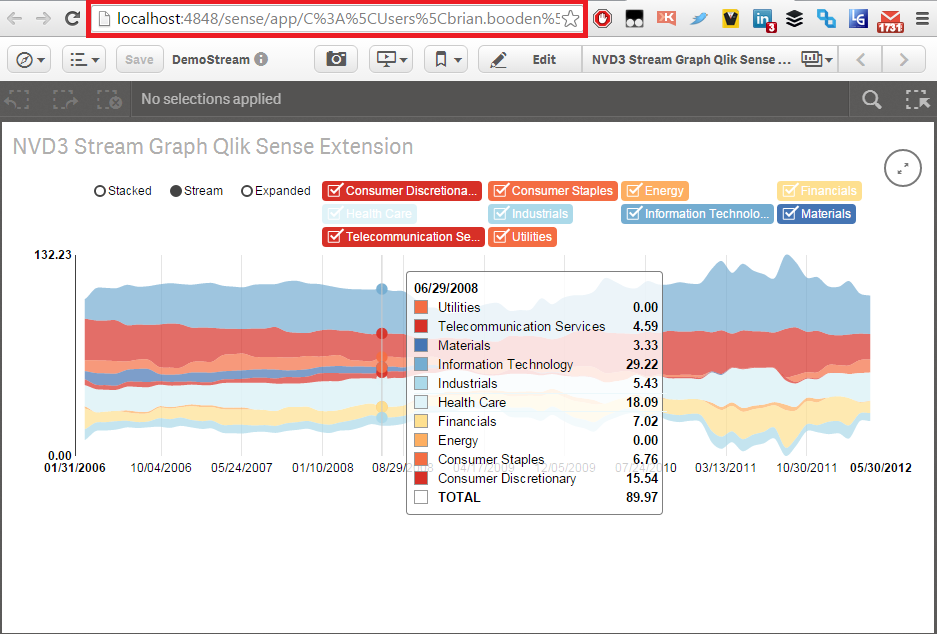
I recently just released a new extension on Qlik Branch. The stream graph is a type of stacked area graph which is displaced around a central axis, resulting in a flowing, organic shape.
You can also convert the stream graph to a stacked area, expanded stacked area, line chart with zoom, stacked bar, and grouped bar. All of this from within the extension using the 'Chart Type' setting.
You can download from Qlik Branch: http://branch.qlik.com/projects/forumdisplay.php?22-Qlik-Sense-Visualization-Extensions
Any questions, just let me know!
Regards,
Brian
2,986 Views
0 Replies