Unlock a world of possibilities! Login now and discover the exclusive benefits awaiting you.
- Qlik Community
- :
- Forums
- :
- Analytics & AI
- :
- Products & Topics
- :
- Integration, Extension & APIs
- :
- QlikSense PieChart Formatting Issue
- Subscribe to RSS Feed
- Mark Topic as New
- Mark Topic as Read
- Float this Topic for Current User
- Bookmark
- Subscribe
- Mute
- Printer Friendly Page
- Mark as New
- Bookmark
- Subscribe
- Mute
- Subscribe to RSS Feed
- Permalink
- Report Inappropriate Content
QlikSense PieChart Formatting Issue
I want to show multiple metrics on a Pie Chart in Qlik Sense. And i want separate formatting for each selection of Metric. e.g(For Percentage Metrics i want 78.8% and for numeric values i want 123,456 )How Can i achieve this functionality in Qlik Sense?
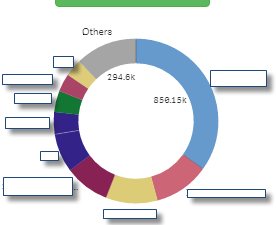
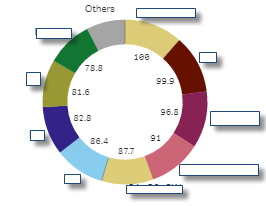
In provided Screenshots, first one is showing right formatting, but i need % sign in second screenshot.
- Mark as New
- Bookmark
- Subscribe
- Mute
- Subscribe to RSS Feed
- Permalink
- Report Inappropriate Content
In Appearance section, select show value as shares.. If you want to show %.
And if you values are in % then in measures section select number format in % which is by default shown as auto
- Mark as New
- Bookmark
- Subscribe
- Mute
- Subscribe to RSS Feed
- Permalink
- Report Inappropriate Content
I don't think this applies to Qlik Sense. Or at least I can't find those options.
But what I do think is that if the measure in your pie chart is changed to a percentage when you go to the properties for the measure and change it from Auto to Number and then pick the percentage format that it will display with the %.
At least it did in my test.
- Mark as New
- Bookmark
- Subscribe
- Mute
- Subscribe to RSS Feed
- Permalink
- Report Inappropriate Content
Try Adding Alternate measures with different number formatting.
- Mark as New
- Bookmark
- Subscribe
- Mute
- Subscribe to RSS Feed
- Permalink
- Report Inappropriate Content
shraddha.g I want to show some metrics as numerics and some as % sign. So, i cant go for shares.
- Mark as New
- Bookmark
- Subscribe
- Mute
- Subscribe to RSS Feed
- Permalink
- Report Inappropriate Content
The metric does not change from the properties, i change it myself from my metric list(as a selection).
- Mark as New
- Bookmark
- Subscribe
- Mute
- Subscribe to RSS Feed
- Permalink
- Report Inappropriate Content
Any example can be very helpful.
- Mark as New
- Bookmark
- Subscribe
- Mute
- Subscribe to RSS Feed
- Permalink
- Report Inappropriate Content
Then try changing number format of the Metric.