Unlock a world of possibilities! Login now and discover the exclusive benefits awaiting you.
- Qlik Community
- :
- Forums
- :
- Analytics & AI
- :
- Products & Topics
- :
- Integration, Extension & APIs
- :
- Switching off continuous scale through Sense Visua...
- Subscribe to RSS Feed
- Mark Topic as New
- Mark Topic as Read
- Float this Topic for Current User
- Bookmark
- Subscribe
- Mute
- Printer Friendly Page
- Mark as New
- Bookmark
- Subscribe
- Mute
- Subscribe to RSS Feed
- Permalink
- Report Inappropriate Content
Switching off continuous scale through Sense Visualization API
Hi all,
Does anyone know how to switch off the continuous scale in the Qlik Sense Visualization API (or other). The problem is that, by default, when creating a linechart visualization on the fly, the x-axis format of a numeric dimension is in ###,#K format.
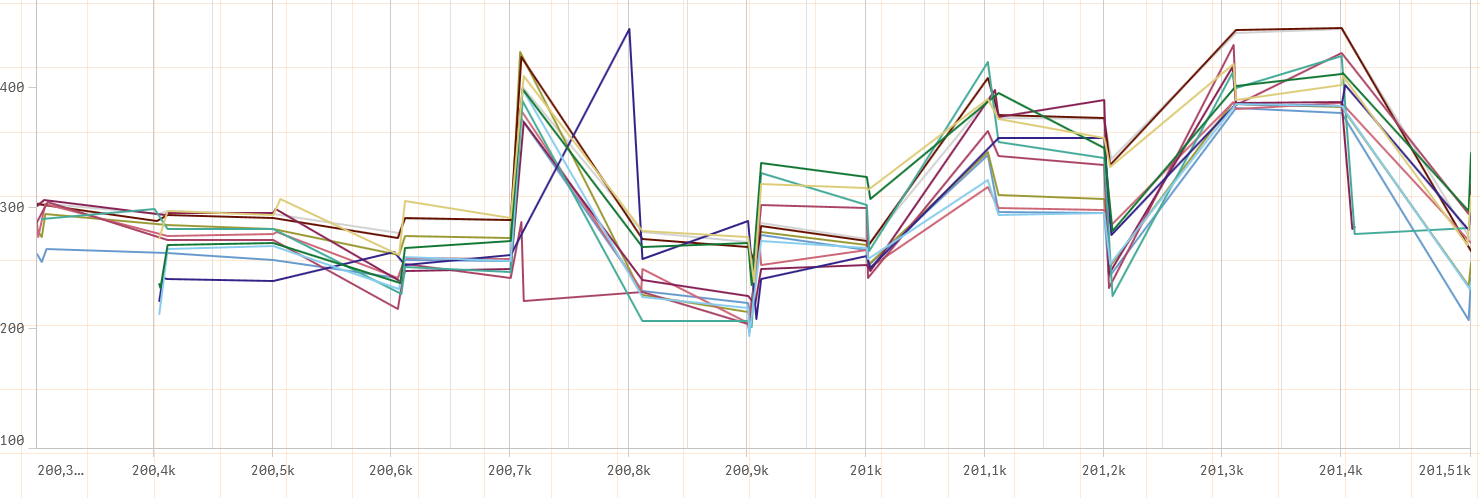
In Qlik Sense, there is a check box which allows the user to un-select this. However, this option does not appear in the properties list of the linechart visualization:
Even though there is a boolean logarithmic property for the measureAxis property, there is not a continuous property under the dimensionAxis property.
I tried adding a line to the properties anyway, just in case it was an undocumented feature, but it did not work.
{
...,
dimensionAxis:{"continuous":false}
}
Any ideas how I can get a six digit number appear as a six digit number rather than with a ...K? I tried using the num() function, but this does not work in native Sense (when the continuous option is checked) or through the API.
Any help would be greatly received.
Richard