Unlock a world of possibilities! Login now and discover the exclusive benefits awaiting you.
Announcements
Q&A with Qlik - Qlik Cloud Migration: Questions about migrating to Qlik Cloud? Catch the latest replay!
- Qlik Community
- :
- Forums
- :
- Analytics & AI
- :
- Products & Topics
- :
- Integration, Extension & APIs
- :
- X-Axis is warped/bent in Qlik Sense Mashup
Options
- Subscribe to RSS Feed
- Mark Topic as New
- Mark Topic as Read
- Float this Topic for Current User
- Bookmark
- Subscribe
- Mute
- Printer Friendly Page
Turn on suggestions
Auto-suggest helps you quickly narrow down your search results by suggesting possible matches as you type.
Showing results for
Partner - Contributor III
2017-07-11
02:46 AM
- Mark as New
- Bookmark
- Subscribe
- Mute
- Subscribe to RSS Feed
- Permalink
- Report Inappropriate Content
X-Axis is warped/bent in Qlik Sense Mashup
Hi,
I have an issue with the integration of Bar Chart, Combo Chart and Line chart in a QS Mashup. Unfortunately, the x-axis of those objects always get warped. See the picture below. This issue only occurs on the x-axis.
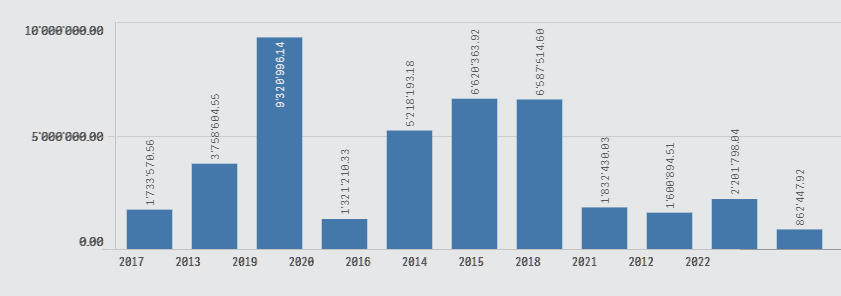
Can somebody give me some advices how to resolve this issue?
I'm using Qlik Sense 3.2 SR4. For the mashup: HTML/CSS and JavaScript.
Thanks in advance for any help.
- Tags:
- mashup
699 Views
1 Solution
Accepted Solutions
Partner - Contributor III
2017-08-11
03:10 AM
Author
- Mark as New
- Bookmark
- Subscribe
- Mute
- Subscribe to RSS Feed
- Permalink
- Report Inappropriate Content
Was an CSS Issue. One Stylesheet overwrote the canvas css.
601 Views
1 Reply
Partner - Contributor III
2017-08-11
03:10 AM
Author
- Mark as New
- Bookmark
- Subscribe
- Mute
- Subscribe to RSS Feed
- Permalink
- Report Inappropriate Content
Was an CSS Issue. One Stylesheet overwrote the canvas css.
602 Views