Unlock a world of possibilities! Login now and discover the exclusive benefits awaiting you.
Announcements
FLASH SALE: Save $500! Use code FLASH2026 at checkout until Feb 14th at 11:59PM ET. Register Now!
- Qlik Community
- :
- Support
- :
- Support
- :
- Knowledge
- :
- Member Articles
- :
- Histogram example
Options
- Move Document
- Delete Document
- Subscribe to RSS Feed
- Mark as New
- Mark as Read
- Bookmark
- Subscribe
- Printer Friendly Page
- Report Inappropriate Content
Histogram example
Turn on suggestions
Auto-suggest helps you quickly narrow down your search results by suggesting possible matches as you type.
Showing results for
Former Employee
- Move Document
- Delete Document and Replies
- Mark as New
- Bookmark
- Subscribe
- Mute
- Subscribe to RSS Feed
- Permalink
- Report Inappropriate Content
Histogram example
The histogram created in Recipe for a Histogram
Comments
2016-07-06
08:16 AM
- Move Comment
- Delete Comment
- Mark as Read
- Mark as New
- Bookmark
- Permalink
- Report Inappropriate Content
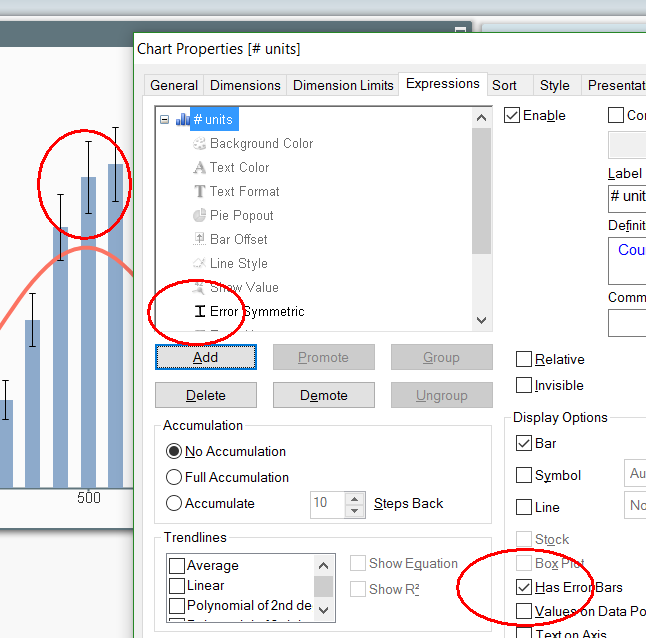
Nice and simple. But, how to get the bar graph image i mean on bar graph many black images are there?
How to show those all?
Anonymous
Not applicable
2016-07-06
08:26 AM
- Move Comment
- Delete Comment
- Mark as Read
- Mark as New
- Bookmark
- Permalink
- Report Inappropriate Content
Former Employee
2016-07-06
08:26 AM
- Move Comment
- Delete Comment
- Mark as Read
- Mark as New
- Bookmark
- Permalink
- Report Inappropriate Content
I think you mean the error bars? The small black lines on top of the bars. There is a check box on the Expressions page. Then you need to set the size of the error bars (under the plus-sign of the expression)

2016-07-06
09:04 AM
- Move Comment
- Delete Comment
- Mark as Read
- Mark as New
- Bookmark
- Permalink
- Report Inappropriate Content
So,
I am trying to create the bell curve
how can i achieve this
I have Year based data. In that, I want to know how much score got the Year wise.
- ANIL
Creator III
2016-07-12
04:20 AM
- Move Comment
- Delete Comment
- Mark as Read
- Mark as New
- Bookmark
- Permalink
- Report Inappropriate Content
Thanks Henric!!! very useful!