Description: This tutorial explains how to associate a filter on a specific table or image object. The "Properties" section of tables and images has the Filter field to let you select an existing filter. You can associate only one filter to each table or image. This gives you the ability to aggregate all your filtering information in a single filter.
Consider that the report performance upon preview or task generation action can be affected by table and image filters because NPrinting will have to perform a single filter application and export for each filtered object.
Object filters are the last to be applied which means they have the highest priority.
The filter application sequence is (lowest priority to highest priority): Task - Recipient - Cycle - Report - Level/Page - Object.
To get consistent output, please keep the following in mind:
1- if the object filter contains selections for fields that are already selected by other filters, the object filter will replace them
2- if the filter contains selections for fields that have never been selected, the object filter will be applied in addition to the current selections
3- if the object filter is a "Clear Selections" type filter, then the object will be affected by all filters other than selections to the field specified in the "Clear Selections" filter
NOTE: Filters based on Linked Fields are not allowed.
Add Filters to the Chart
After adding a chart as image or table in a new template:
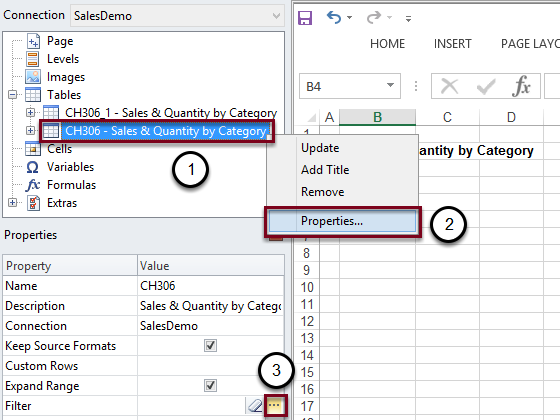
- Right click on the table node
- Select Properties
- Click on the three dots button. You can also clear all applied filters by clicking on the eraser button to the left of the three dots button.
Also see Select the Filter to be Added to the Image
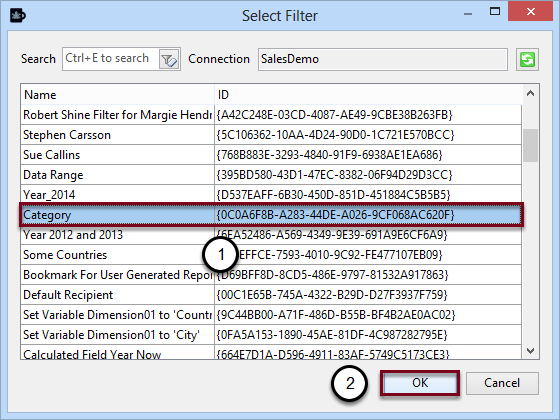
- Select Category
- Click on OK
Create the Template
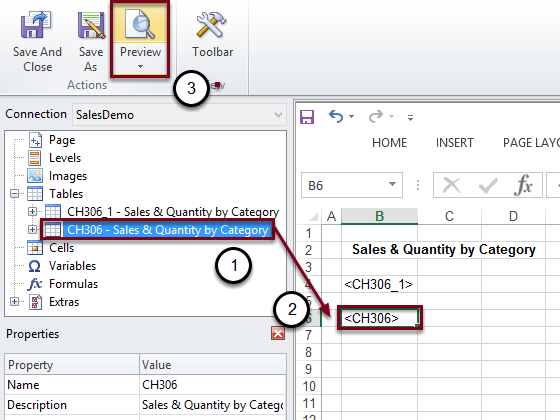
- Select the CH306 table
- Drag and drop it
- Click on the Preview button
Result
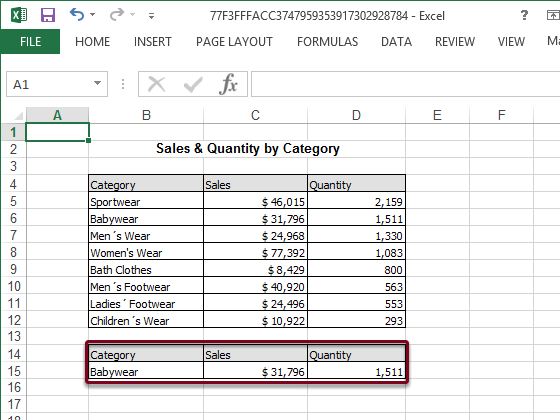
The chart has been filtered by the Category filter