Unlock a world of possibilities! Login now and discover the exclusive benefits awaiting you.
- Qlik Community
- :
- Support
- :
- Support
- :
- Knowledge
- :
- Member Articles
- :
- How to Create HTML Reports
- Move Document
- Delete Document
- Subscribe to RSS Feed
- Mark as New
- Mark as Read
- Bookmark
- Subscribe
- Printer Friendly Page
- Report Inappropriate Content
How to Create HTML Reports
- Move Document
- Delete Document
- Mark as New
- Bookmark
- Subscribe
- Mute
- Subscribe to RSS Feed
- Permalink
- Report Inappropriate Content
How to Create HTML Reports
Nov 6, 2015 6:35:13 AM
Nov 6, 2015 6:35:13 AM
This tutorial is intended to illustrate HTML report creation. It is presumed that you are familiar with common NPrinting procedures.
We are going to embed images of two QlikView objects in an HTML report in this tutorial, and then add a level and the level variable tag as the label to HTML report which will then have an appropriate title and images in a frame for each of three years.
Open an existing NPrinting document or a new one. We will use a sample QlikView document, SalesDemo.qvw, for this tutorial. Establish a connection to SalesDemo.qvw (see: How to Connect to your QlikView documents).
Add New HTML Report
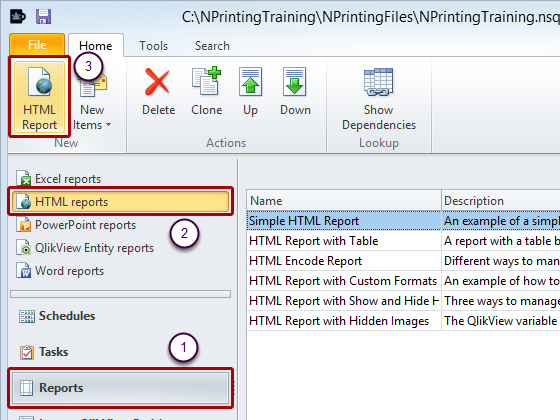
- Select Office Reports in the lower left-hand pane
- Select the HTML reports in the pane immediately above
- Select HTML Report in the New group of the tool ribbon
Create New HTML Report
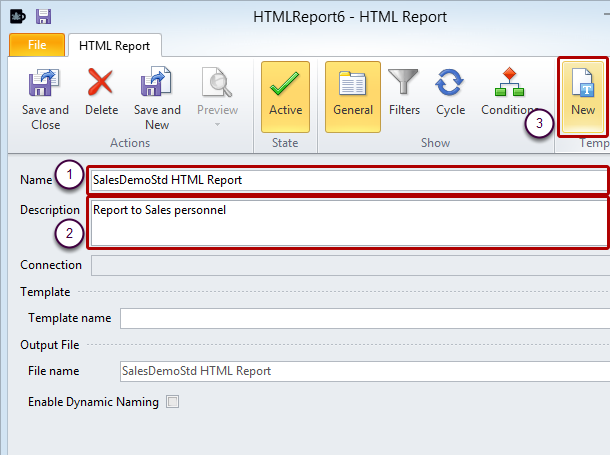
- Enter a Name for your report
- Enter optionally a Description
- Select New in the Template group of the tool ribbon.
Create New HTML Template: Open Select Objects Window for Images
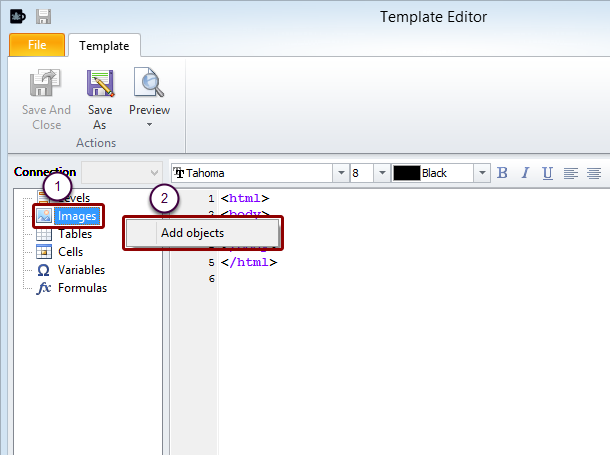
- Right click on the Images node icon or label in the left pane
- Select Add objects
Select Connection and Objects to Add
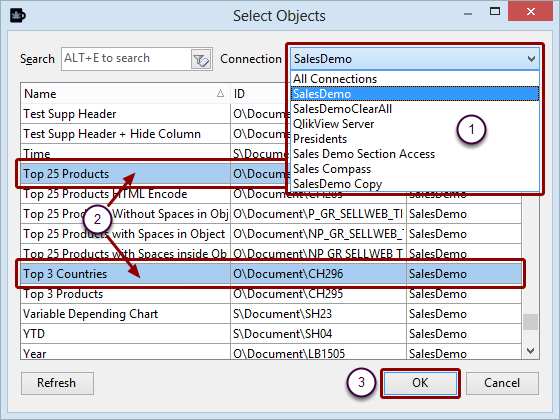
Import images of QlikView objects:
- If you need QlikView objects from a specific connected QlikView document, select the corresponding connection
- Select the objects, Top 25 Products and Top 3 Countries in this case
- Click on the OK button
Embed Images in Template
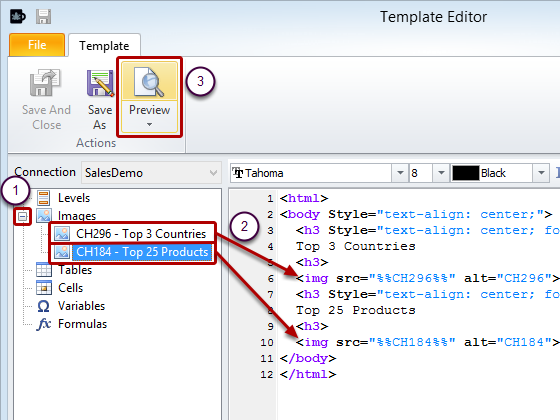
- Expand the Images node in the left pane by clicking on the '+' to its left
- Drag and drop the CH296 - Top 3 Countries, and CH184 - Top 25 Products tokens onto lines between the <body> and </body> tags. Add lines as necessary and some block element tags such as <p>, <table>, or <div> for layout management and inline style elements if necessary
- Click on the Preview icon in the Actions group
Resulting Report
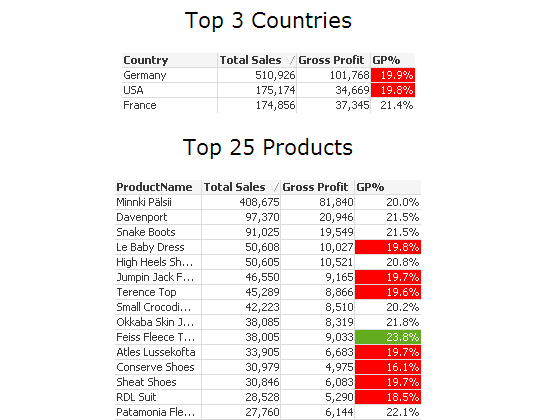
This resulting HTML report is the result of the code that follows:
<html>
<body Style="text-align: center;">
<h3 Style="text-align: center; font: 21px verdana;">
Top 3 Countries
<h3>
<img src="%%CH296%%" alt="CH296">
<h3 Style="text-align: center; font: 21px verdana;">
Top 25 Products
<h3>
<img src="%%CH184%%" alt="CH184">
</body>
</html>
Open Select Levels Window
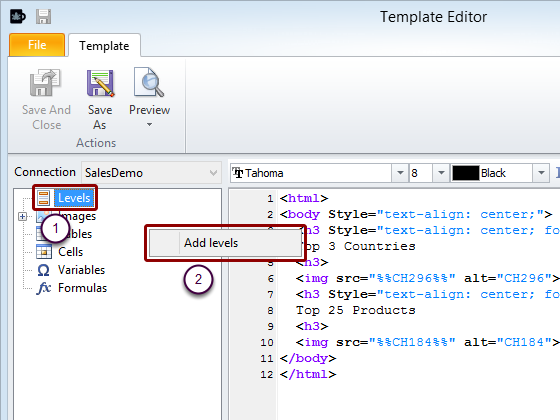
Your HTML report can be produced with levels. For example, to produce a level that cycles through each year:
- Right click on the Levels node icon or label in the left pane
- Select Add levels
Multi-Level HTML Report: Select Level
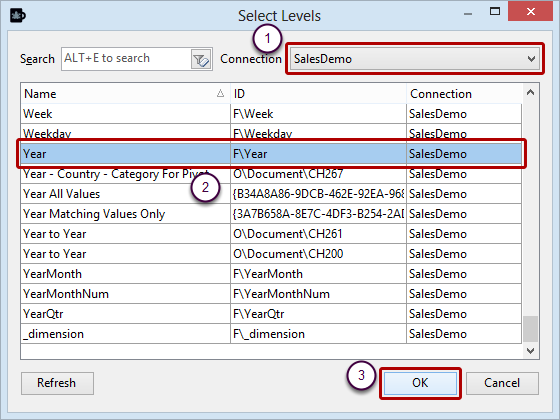
- If you need a QlikView field from a specific connected QlikView document, select the corresponding Connection
- Select the Year field from the list in the Select Levels window
- Select OK
Add Year_Level to Template
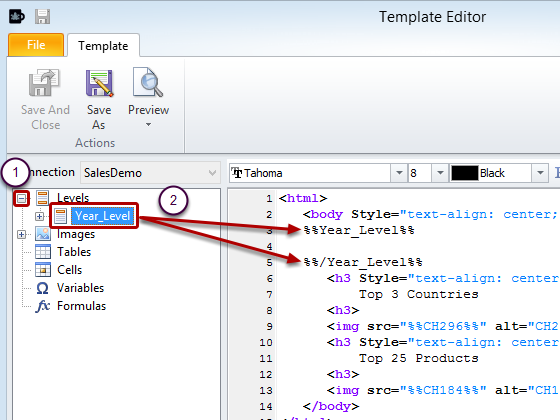
- Expand the Levels node in the left pane by clicking on the '+' to its left
- Drag and drop the Year_Level node token onto a line between the <body> and </body> tags
Add lines if necessary. The result is three new lines, %%Year_Level%%, %%/Year_Level%% with a blank line between.
Place Content into Level Cycle
Arrange the %%Year_Level%% line before and the %%/Year_Level%% line after the elements that you want to be included in the level cycle.
Add Level Cycle Title
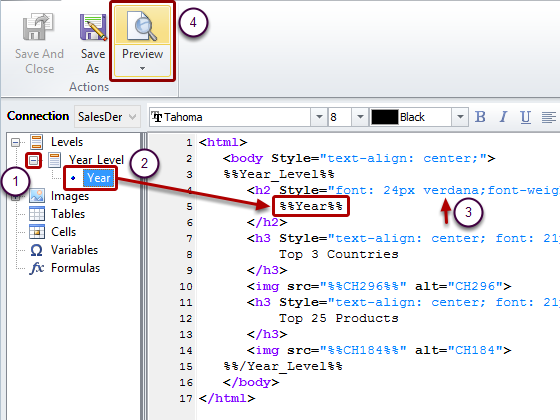
- Expand the Year_Level node in the left pane by clicking on the '+' to its left
- Drag and drop the Year node token onto a line between the %%Year_Level%% and the %%/Year_Level%% lines
- Add inline style elements
- Click on the Preview icon
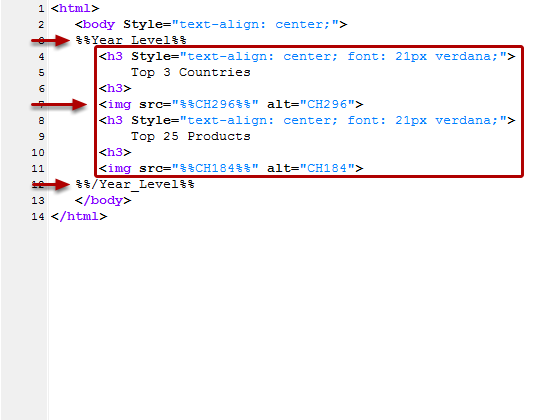
Here is the code for this simple HTML report:
<html>
<body Style="text-align: center;">
%%Year_Level%%
<h2 Style="font: 24px verdana;font-weight: bold;">
%%Year%%
</h2>
<h3 Style="text-align: center; font: 21px verdana;">
Top 3 Countries
</h3>
<img src="%%CH296%%" alt="CH296">
<h3 Style="text-align: center; font: 21px verdana;">
Top 25 Products
</h3>
<img src="%%CH184%%" alt="CH184">
%%/Year_Level%%
</body>
</html>
Preview Resulting HTML Report
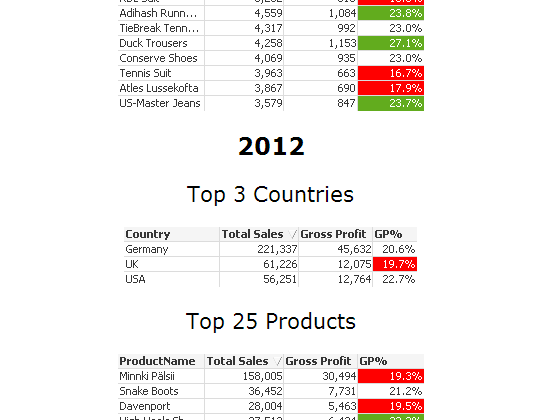
The code above produces this HTML report having three titled sections, one for each year. Simple results with simple style elements.