Unlock a world of possibilities! Login now and discover the exclusive benefits awaiting you.
- Qlik Community
- :
- Support
- :
- Support
- :
- Knowledge
- :
- Member Articles
- :
- How to Manage PixelPerfect Conditional Output Form...
- Move Document
- Delete Document
- Subscribe to RSS Feed
- Mark as New
- Mark as Read
- Bookmark
- Subscribe
- Printer Friendly Page
- Report Inappropriate Content
How to Manage PixelPerfect Conditional Output Formats Using the Formatting Rules Editor
- Move Document
- Delete Document
- Mark as New
- Bookmark
- Subscribe
- Mute
- Subscribe to RSS Feed
- Permalink
- Report Inappropriate Content
How to Manage PixelPerfect Conditional Output Formats Using the Formatting Rules Editor
Nov 10, 2015 4:56:47 AM
Nov 10, 2015 4:56:47 AM
This article explains how to create PixelPerfect reports with a conditional table display view. The final output will show a page that contains a Chart and a Table that will completely be hidden when it doesn't contain data.
Create New PixelPerfect Report
Run NPrinting Client and open the project C:\NPrintingTraining\NPrintingFiles\NPrintingTraining.nsq
- Click on Reports
- Select PixelPerfect reports
- Click on the PixelPerfect Report button to create a new one
- Enter PixelPerfect Report Conditional Table Display as the report Name
Create a New PixelPerfect Report Template
- Click on New to open a blank template in the Template Editor
- Right-click on the Levels node to add a level
- Select the Add levels option
Insert a QlikView Table as a Level
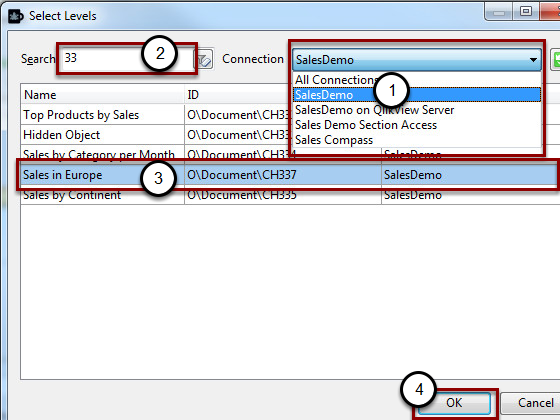
- Be sure that the Connection "SalesDemo" is selected, otherwise open the "Connection" drop-down menu and select it
- Enter '337' into the search field and the number of candidate objects will be reduced
- If Sales in Europe (CH337) is the only visible object, press Enter to add it into the Levels node; otherwise select it in the list
- Click on the OK button
Change the "Visible" Property in the Details Band
Create a new table, as you would normally do in a PixelPerfect report, based on CH337. Refer to the tutorial "How to Create a Simple PixelPerfect Report".
Then:
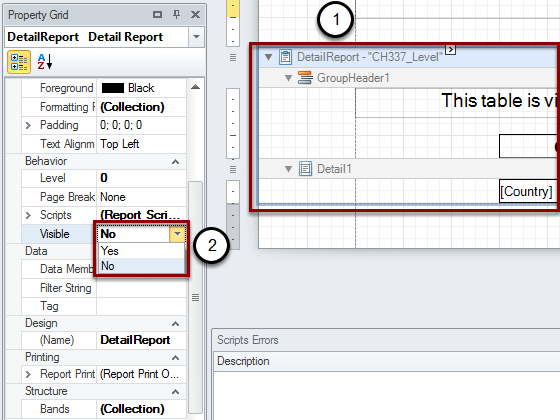
- Select DetailReport - "CH337_Level"
- Change the "Visible" property from "Yes" to "No".
Open the Formatting Rule Editor

- Select the Detail Band
- Click on the smart tag (">") button at the top of the band
- Click on the browse button at the right end of the Formatting Rules field to open the Formatting Rules Editor.
Create a New Rule
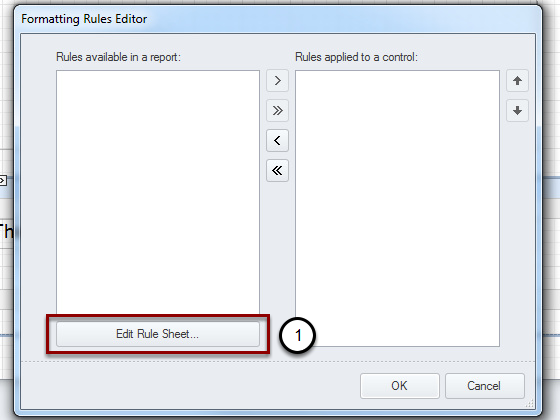
This form shows all the available rules in a report.
- Click on Edit Rule Sheet.
Create a New Formatting Rule
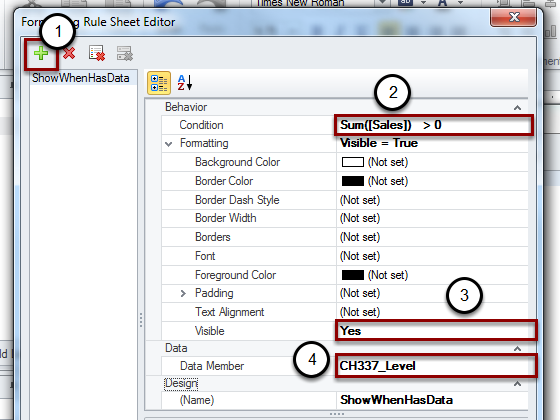
- Click on the "+" button to add a new rule
- Select CH337_Level as a Data Member value
- Insert Sum([Sales]) > 0 in the Condition property. This condition will be true when the selected QlikView Object contains data. By customizing this condition you can met your needs.
- Set the "Visible" property to "Yes" from the drop-down menu. This means that when the condition is true the objects with the condition applied will be made visible
- Insert ShowWhenHasData as Name
- Click Close.
Apply the Formatting Rule to the Table
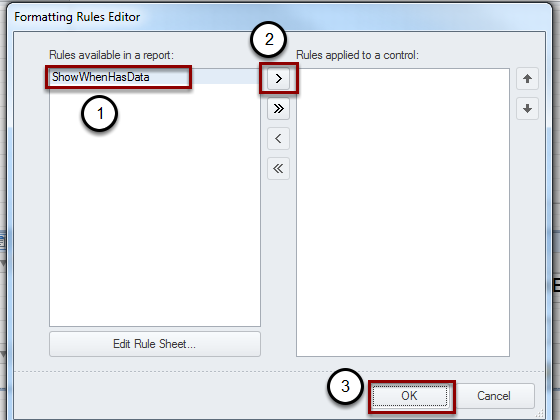
- Select ShowWhenHasData Rule from the list
- Click on the button ">" to apply the rule
- Confirm with OK.
Create a New Filter

- Click on Filters
- Filters will be automatically select
- Click on the Filter button to create a new one
- Insert Rock Roll Sales as Name
- Click Add button.
For more details on how to create a field based filter refer to the tutorial How to Create Static and Dynamic Filters Based on Fields
Select Field
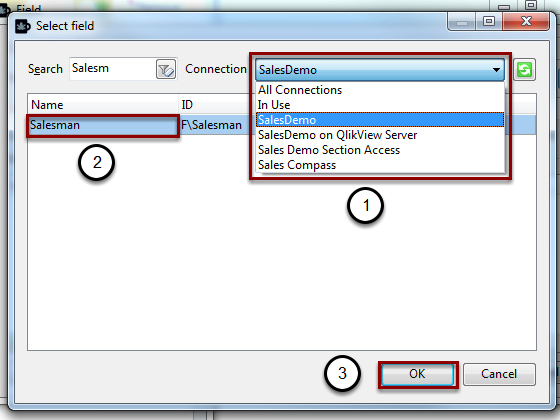
- Select the Connection "SalesDemo"
- Search and select the Salesman field
- Click on the OK button to add the field.
Select "Rock Roll"
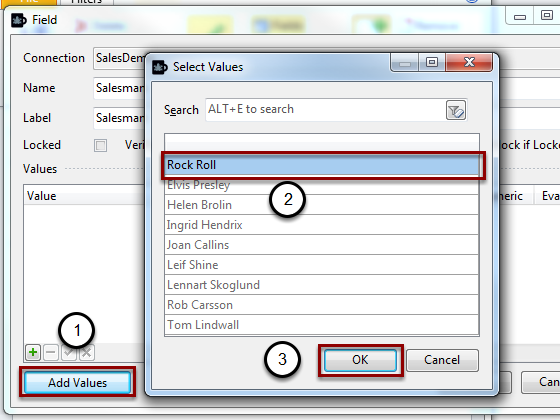
- Click on the Add Values button in the Field window, which opens the Select Values window listing all the values for that field present in the QlikView document
- Select Rock Roll
- Click on the OK button at the bottom of the Select Values window
- Save and Close.
Create a Filter for "Tom Lindwall"
- Create another Filter for "Tom Lindwall"
- Add it to the report.
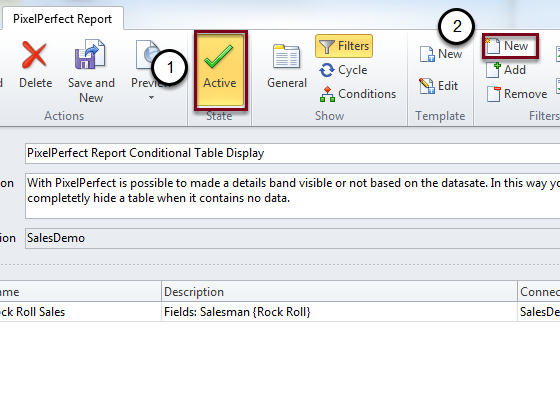
Deactivate a Filter
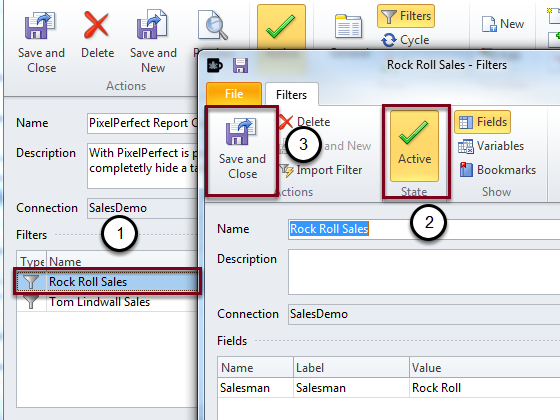
- Double-click on the first Filter (Rock Roll Sales)
- Click on Active button to deactivate the Filter
- Exit by clicking on Save and Close.
Generate Preview
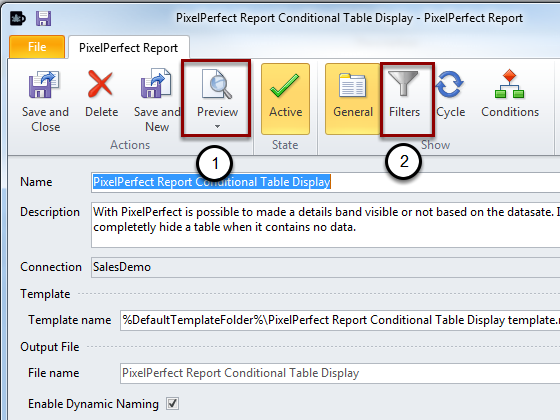
- Select Preview button to generate the preview. Keep it open.
- Click on Filters button and re-activate "Rock Roll" Filter and disable "Tom Lindwall"
- Save and Close
- Re-click on Preview button.
Compare Previews
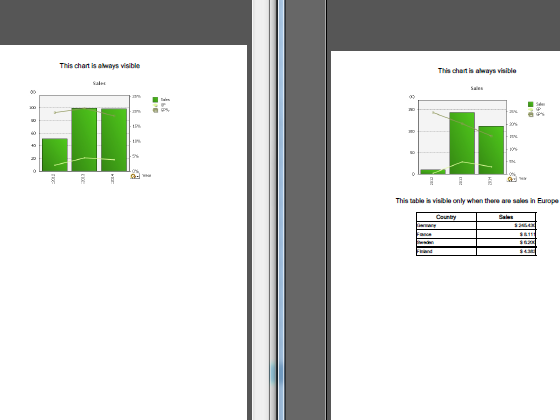
You can see the table only on the second Preview.