Unlock a world of possibilities! Login now and discover the exclusive benefits awaiting you.
- Qlik Community
- :
- Support
- :
- Support
- :
- Knowledge
- :
- Member Articles
- :
- Missing Manual - Above() and Below()
- Move Document
- Delete Document
- Subscribe to RSS Feed
- Mark as New
- Mark as Read
- Bookmark
- Subscribe
- Printer Friendly Page
- Report Inappropriate Content
Missing Manual - Above() and Below()
- Move Document
- Delete Document and Replies
- Mark as New
- Bookmark
- Subscribe
- Mute
- Subscribe to RSS Feed
- Permalink
- Report Inappropriate Content
Missing Manual - Above() and Below()
![]() Have you ever wondered how the examples from the Qlikview help may look like?
Have you ever wondered how the examples from the Qlikview help may look like?
Please see below and enjoy responsibly...
Below() and Above()

Returns the value of expression evaluated with the chart's dimension values as they appear on the row above the current row within a column segment in a table or, in the case of bitmap charts, in the chart's straight table equivalent (Actually all QlikView charts have a straight table equivalent with the exception of the pivot table which has a more complex structure.).
On the first row of a column segment a NULL value will be returned, as there is no row above this one.
If the chart is one-dimensional or if the expression is preceded by the total qualifier, the current column segment is always equal to the entire column........
![]()
- Returns value from previous (Above) ornext (Below) row(s)
- Returns NULL for the first or last row.
- Equivalent to before()and after()for columns in Pivot Table.
Syntax:


TOTAL[<fld{,fld}>]]expr - expression
offset - if greater that 0 will move the evaluation of expression to rows
further down or above
count - this parameter will only works with Chart Range Function (like RangeSum), it will specify the numbers of rows to be taken for calculations.(Please see last example)
Data Model:
(Copy and Pasted below code into Edit Script window and reload)
LOAD * inline
[
Year ,Month ,Sales
2015 ,January, 10
2015, February,20
2015 ,March ,30
2014 ,January ,10
2014 ,February,20
2014 ,March ,30
2013 ,January ,10
2013 ,February ,20
2013 ,March,30
]
Example 1:
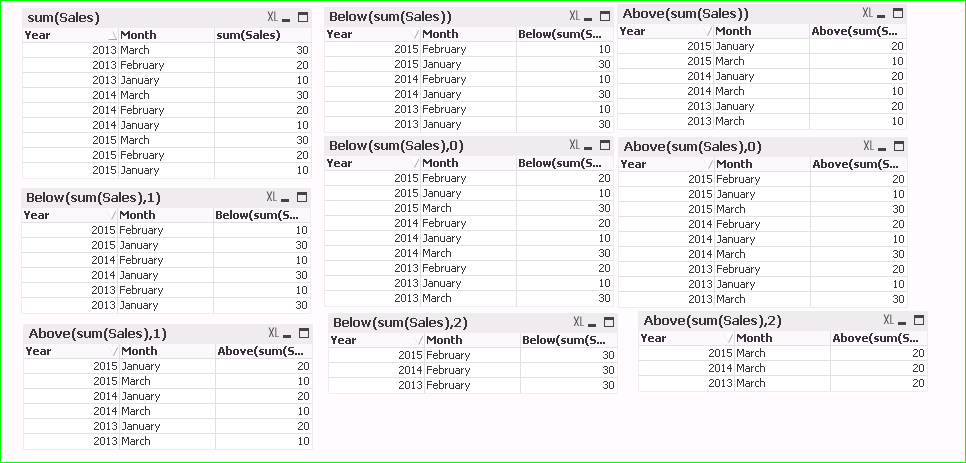
Let's build a Straight Table with Year and Month as dimensions and expressions as below:
The left hand side shows use of sum(Sales) the right hand side result from our new expression.
sum( Sales ) -----------> above(sum( Sales ) )
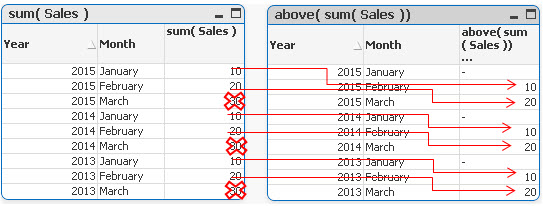
In each groups the first value is now NULL,the last values(30) have been omitted and the rest of the rows have been assigned value from one row below current row.
sum( Sales ) -----------> below(sum( Sales ) )
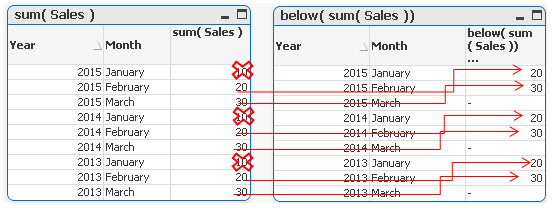
In each groups the last value is now NULL,the first values (10) in each group have been omitted and the rest of the rows have been assigned value from one row below current row.
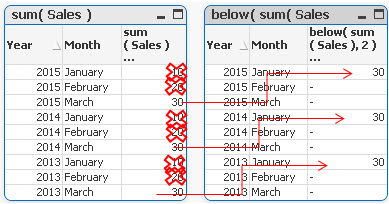
Example 2
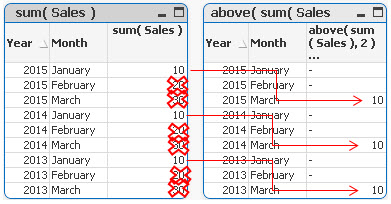
By specifying the second criteria as 2 ,values in each group are shifted two rows up or down
sum( Sales )-----------> below sum( Sales ), 2 )
sum( Sales )-----------> above( sum( Sales ), 2 )
Example 3
above(TOTAL sum( Sales ) ) below(TOTAL sum( Sales ) )
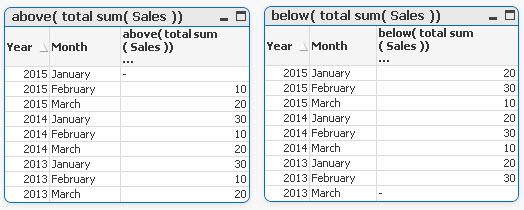
Adding TOTAL before Sum will result with the first or last value to be omitted and the calculation to be shifted one row down or up.
Example 4
rangeavg (Above(sum(Sales),1,2))
rangeavg (Below(sum(Sales),1,2))
RangeAvg() takes 3 parameters
-expression ---> Above/Below(sum(Sales),
-offset of rows--->1
-number of rows to sum--->2
sum(Sales) rangeavg (Above(sum(Sales),1,2))
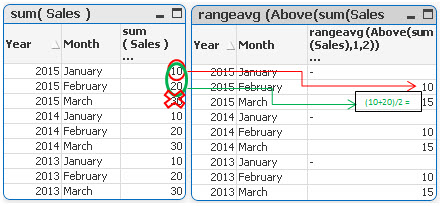
For each group in right table:
- First row is NULL
- Rows 2 and 3 are averages of values from two rows above current one (first we are going 1 row above and then adding 2 rows)
sum(Sales) rangeavg (Below(sum(Sales),1,2))
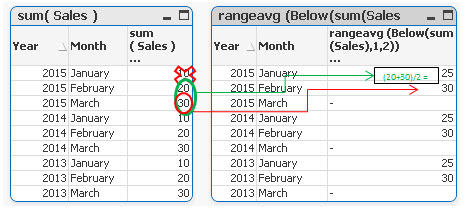
For each group in right table:
- Rows 1 and 2 are averages of values from two rows below current one (first we are going 1 row above and then adding 2 rows)
- Last row is NULL
Still feeling hungry?
Do you Qualify?- How to use QUALIFY statement
Missing Manual - GetFieldSelections() + Bonus Example
MaxString & MinString - How to + examples
The second dimension... or how to use secondarydimensionality()
Missing Manual - Below() and Above()
- Move Comment
- Delete Comment
- Mark as Read
- Mark as New
- Bookmark
- Permalink
- Report Inappropriate Content
Yep!
That is one of the really useful things in the book "Mastering QlikView" I'm just reading. However, an example is always helpful.
Using this you can e.g. calculate a rolling average of the last few months in any type of chart (it is possible to just switch the type of chart to "straight table" to visualize just what this function will do and then switch back)
- Move Comment
- Delete Comment
- Mark as Read
- Mark as New
- Bookmark
- Permalink
- Report Inappropriate Content
Brilliant solved my queries regarding the above function
- Move Comment
- Delete Comment
- Mark as Read
- Mark as New
- Bookmark
- Permalink
- Report Inappropriate Content
Hi Robert,
For the first example , I am not getting the same output as yours.
when Case is sum( Sales ) -----------> above(sum( Sales )
Output which i am getting is:
It is by default showing result for offset 1.
Could you please help.
Thanks
Manish
- Move Comment
- Delete Comment
- Mark as Read
- Mark as New
- Bookmark
- Permalink
- Report Inappropriate Content
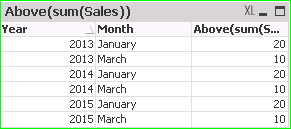
Hi,
Somehow i am not getting the same output as yours,Attached Screenshot for reference:
Thanks
Manish
- Move Comment
- Delete Comment
- Mark as Read
- Mark as New
- Bookmark
- Permalink
- Report Inappropriate Content
Hi manish,
u need to sort the month column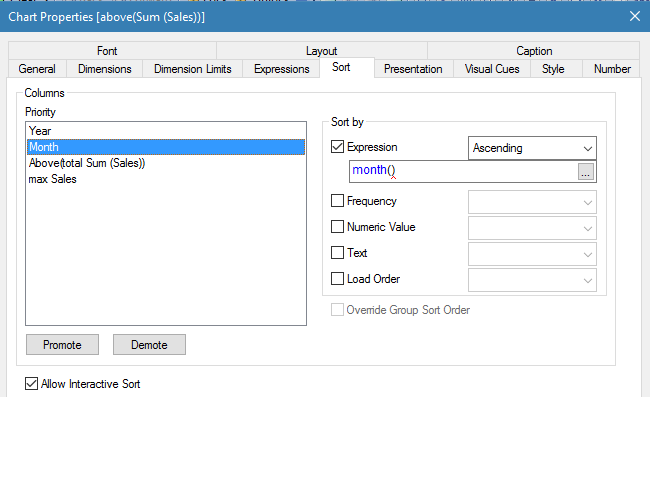
- Move Comment
- Delete Comment
- Mark as Read
- Mark as New
- Bookmark
- Permalink
- Report Inappropriate Content
Just another excellent How To. Thanks robert_mika !
- Move Comment
- Delete Comment
- Mark as Read
- Mark as New
- Bookmark
- Permalink
- Report Inappropriate Content
Thanks for the useful information.
- Move Comment
- Delete Comment
- Mark as Read
- Mark as New
- Bookmark
- Permalink
- Report Inappropriate Content
Somebody tell me... "why"
functions like RangeSum can "deshifrate" result of Above function
f.e. =RangeSum(above(sum(Sales),0,RowNo())) <-- it works
but... =Concat(above(sum(Sales),0,RowNo()),',') <-- it dznt work 🙄
... why "About" function doesn't return natively the array of values if we try use it according to it's description with ofset and count flags?