- Move Document
- Delete Document and Replies
- Mark as New
- Bookmark
- Subscribe
- Mute
- Subscribe to RSS Feed
- Permalink
- Report Inappropriate Content
Period Presets: Compare Periods on the fly
Oct 18, 2022 6:44:11 AM
Jul 7, 2016 8:56:29 AM
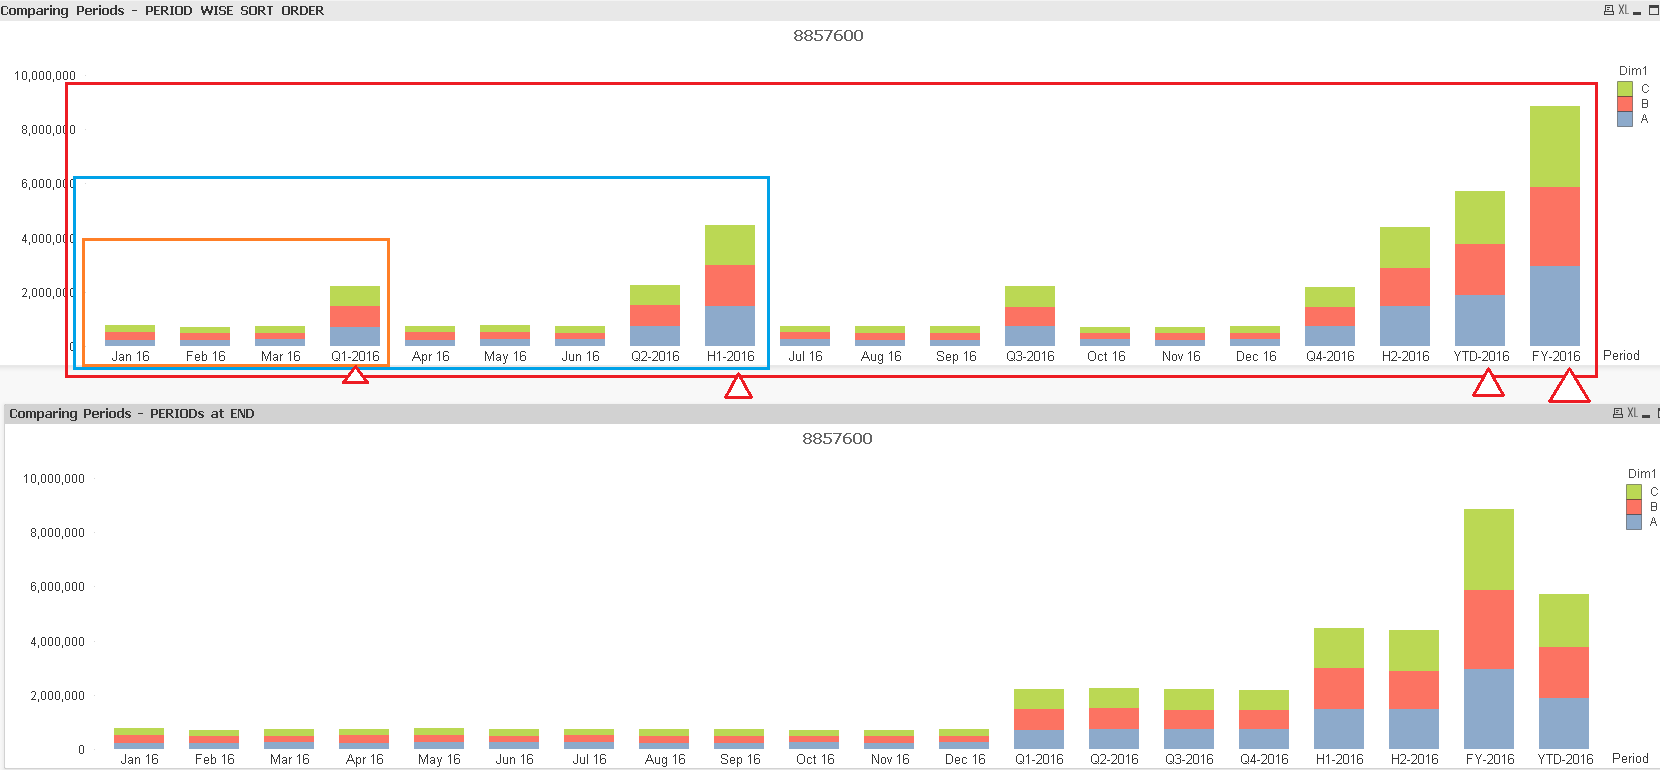
Preset Calendar now with Sort Order
Added two Sorting Order options.
First chart showing Periods immediately after the period ends
example; Q1 after Jan,Feb,Mar and H1 immediately after 1st half of the year is completed.
While the Second chart shows Period totals towards the end.
||||||||||||||||||||||||||||||||||||||||||||||||||||||||||||||||||||||||||||||||||||||||||||||||||||||||||||||||||||||||||||||||||||||||||||||||||||||||||||||||||||||||||||||||||||||||||||||||||||||||||||||||||||||||||||||||||||||||||||||||||||||||||||||
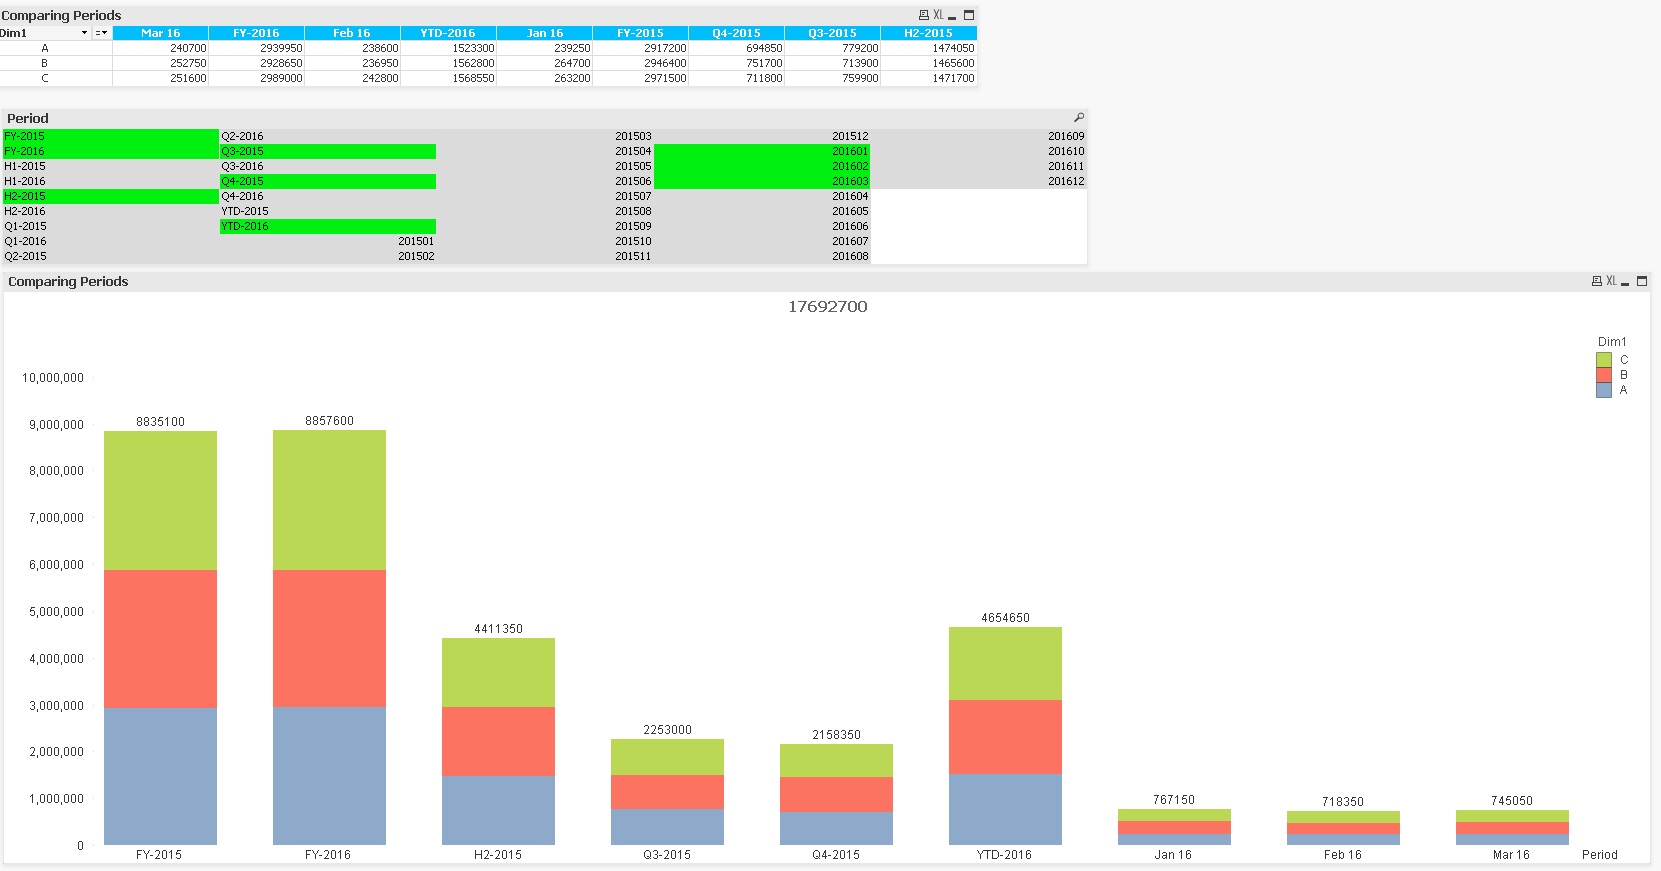
Comparing metrics for two or more periods is probably a common scenario for all developers in all organizations no matter what domain they are working in.
A Trend comparison between two or more periods for which we’ve been performing set analysis using variables. My App is a simple transformation of the Master Calendar, which allows the users to visualize and evaluate data across multiple periods dynamically without using variables.
For people who think master calendar is of no use, this is probably the best way you would actually making use of it.
Benefits:
- Most beneficial for ease of visualization and provides easy filters for comparing periods for Business users
- No greater than less Set Analysis for comparing dates between
- Simplifies expressions for faster dashboard performanceJ
- Extended Flexibility for comparing multiple periods, without being restricted by variables.
Attached is just a sample made with Auto generated data.
I would like to hear expert’s reviews.
Cheers
V
Vineeth Pujari
- Move Comment
- Delete Comment
- Mark as Read
- Mark as New
- Bookmark
- Permalink
- Report Inappropriate Content
- Move Comment
- Delete Comment
- Mark as Read
- Mark as New
- Bookmark
- Permalink
- Report Inappropriate Content
I've used this sort of linkage table before, but I don't think it ever occurred to me how simple it would be to build the table using crosstable. Thanks for the idea!
Edit: Incorporated into my own master calendar logic.
- Move Comment
- Delete Comment
- Mark as Read
- Mark as New
- Bookmark
- Permalink
- Report Inappropriate Content
Clever use of CrossTable!
I'm not understanding the use case though. Is this if you want to compare unlike periods, like comparing half years to full years?
If I just want to compare quarters to quarters, I can use a standard master calendar. Can you describe a use case?
- Move Comment
- Delete Comment
- Mark as Read
- Mark as New
- Bookmark
- Permalink
- Report Inappropriate Content
Edit: Solved using load order and proper sequence of fields in the crosstable load. Thanks Rob.
I quickly ran into trouble using crosstable.
One weakness with the resulting periods, and in your master calendar at least, with your other fields, is that they aren't dates, so they aren't easily sorted in a normal ascending or descending calendar order. That can be useful if you want to compare H1-2015 to H1-2016, and H2-2015 to H2-2016, as they'll be in that order. But we would typically want to see them in an ascending order by date. There is no date here, though, only text.
For my master calendar, I used dual() or date formatting to assign the first date of my periods to each of my periods. So I would say date(yearstart([Date]),'YYYY') as [Year] instead of year([Date]) as [Year], for instance. My exception was [Week Ending], which of course was assigned the last date of the period.
That reasonably corresponds to periods where the period total is shown before smaller subtotals. But that's a little tricky. Crosstable wipes out the underlying dates. But keeping the underlying dates doesn't work either, as once they're all assigned to the period field, we'd only see whatever text value was loaded first for a date. To fix that, I settled for re dual()ing my dates to turn them into timestamps, adding a different number of seconds to each period type.
So this is far uglier than crosstable, and maybe someone can think of a more elegant solution, but this is what I currently have:
[CP]: LOAD [Date],dual(text([Year] ),[Year] +maketime(0,0,01)) as [Period],'Year' as [Period Type] RESIDENT [Calendar];
CONCATENATE ([CP]) LOAD [Date],dual(text([Compare YTD]),[Compare YTD]+maketime(0,0,02)) as [Period],'Compare YTD' as [Period Type] RESIDENT [Calendar] WHERE [Compare YTD];
CONCATENATE ([CP]) LOAD [Date],dual(text([Current YTD]),[Current YTD]+maketime(0,0,03)) as [Period],'Current YTD' as [Period Type] RESIDENT [Calendar] WHERE [Current YTD];
CONCATENATE ([CP]) LOAD [Date],dual(text([Half] ),[Half] +maketime(0,0,04)) as [Period],'Half' as [Period Type] RESIDENT [Calendar];
CONCATENATE ([CP]) LOAD [Date],dual(text([Quarter] ),[Quarter] +maketime(0,0,05)) as [Period],'Quarter' as [Period Type] RESIDENT [Calendar];
CONCATENATE ([CP]) LOAD [Date],dual(text([Month] ),[Month] +maketime(0,0,06)) as [Period],'Month' as [Period Type] RESIDENT [Calendar];
CONCATENATE ([CP]) LOAD [Date],dual(text([Week Number]),[Week Number]+maketime(0,0,07)) as [Period],'Week Number' as [Period Type] RESIDENT [Calendar];
CONCATENATE ([CP]) LOAD [Date],dual(text([Week Ending]),[Week Ending]+maketime(0,0,08)) as [Period],'Week Ending' as [Period Type] RESIDENT [Calendar];
CONCATENATE ([CP]) LOAD [Date],dual(text([Week] ),[Week] +maketime(0,0,09)) as [Period],'Week' as [Period Type] RESIDENT [Calendar];
CONCATENATE ([CP]) LOAD [Date],dual(text([Date] ),[Date] +maketime(0,0,10)) as [Period],'Date' as [Period Type] RESIDENT [Calendar];
- Move Comment
- Delete Comment
- Mark as Read
- Mark as New
- Bookmark
- Permalink
- Report Inappropriate Content
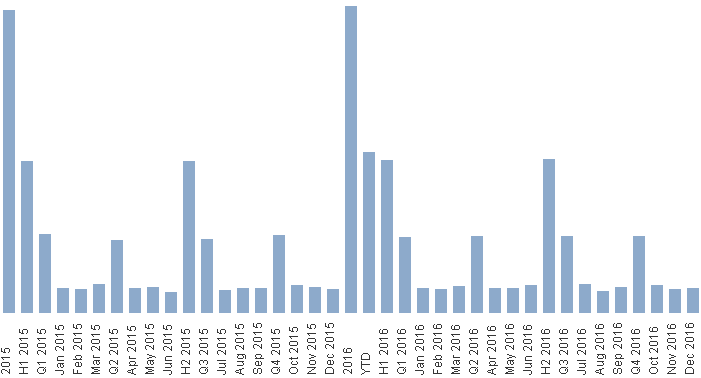
An example use case would be a bar chart with months, but also with subtotals by quarter and year. Something like the picture I just posted, say.
Not the same use case, but for example, this request:
https://community.qlik.com/thread/223790
Another approach to that might be a pivot table with the Year, Quarter, and Month as dimensions and use subtotals, but that wasn't what was requested.
- Move Comment
- Delete Comment
- Mark as Read
- Mark as New
- Bookmark
- Permalink
- Report Inappropriate Content
John, you may be able to work around the sorting problem a bit by using "Load Order" as the sort.
- Move Comment
- Delete Comment
- Mark as Read
- Mark as New
- Bookmark
- Permalink
- Report Inappropriate Content
Ah, right, that works. Thanks, Rob.
Subtotals before (sort in load order):
[CP]:
CROSSTABLE ([Period Type],[Period])
LOAD
[Date]
,text([Year]) as [Year]
,text([Half]) as [Half]
,text([Quarter]) as [Quarter]
,text([Month]) as [Month]
RESIDENT [Calendar]
;
Subtotals after (sort in load order reversed):
[CP]:
CROSSTABLE ([Period Type],[Period])
LOAD
[Date]
,text([Year]) as [Year]
,text([Half]) as [Half]
,text([Quarter]) as [Quarter]
,text([Month]) as [Month]
RESIDENT [Calendar]
ORDER BY [Date] DESC
;
It makes me uncomfortable having "dates" that are just text, but I'll get over my discomfort for the simplicity. And my underlying dates are all true dates, even my quarters and halves.
Edit: I should point out that it's important that your Period fields be listed in the given order, from bigger to smaller periods. When you have overlapping periods, you may want to experiment with the order you put them in the load. Also, I'm using text() because my underlying fields are all dates, which, like dual(), can only map a number in a field to a single text representation.
- Move Comment
- Delete Comment
- Mark as Read
- Mark as New
- Bookmark
- Permalink
- Report Inappropriate Content
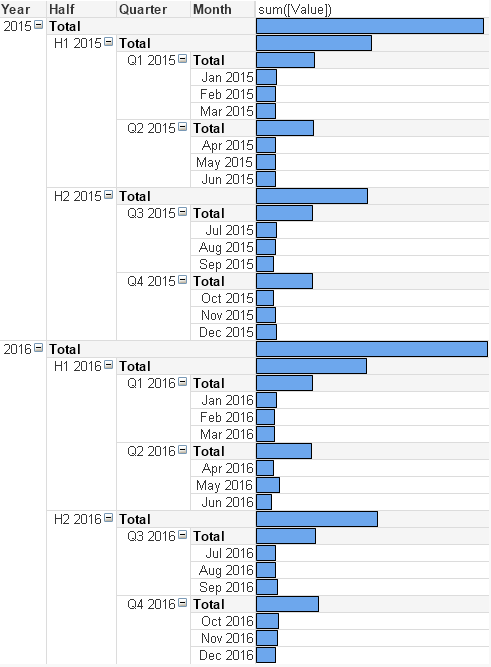
Here's the pivot table approach to produce something similar to the bar chart I posted. But it's limited to horizontal display and it breaks down when adding overlapping periods. This doesn't contain the YTD bar, for instance.
- Move Comment
- Delete Comment
- Mark as Read
- Mark as New
- Bookmark
- Permalink
- Report Inappropriate Content
- Move Comment
- Delete Comment
- Mark as Read
- Mark as New
- Bookmark
- Permalink
- Report Inappropriate Content
Hi Rob,
The purpose is to compare multiple periods, multiple types of periods and even overlapping without having multiple expressions.
You can create a Static chart to compare quarter to quarter, month to month or provide drill down chart which adds to that many steps the user has to take to view the data, which doesn't really enable the user compare or analyse the trend because the user is only viewing one period type.
Cheers
V